The Journal of Chemical Physics, 08 January 2005
J. Chem. Phys. 122, 024901 (2005) (18 pages)
©2005 American Institute of Physics. All rights reserved.
Up: Issue Table of Contents
Go to: Previous Article | Next Article
Other formats: HTML (smaller files) | PDF (245 kB)
How effective for fold recognition is a potential of mean force that includes relative orientations between contacting residues in proteins?
Sanzo Miyazawaa)
Faculty of Technology, Gunma University, Kiryu, Gunma 376-8515, Japan
Laurence H. Baker Center for Bioinformatics and Biological Statistics, Plant Sciences Institute, Iowa State University, Ames, Iowa 50011-3020
Robert L. Jerniganb)
Laurence H. Baker Center for Bioinformatics and Biological Statistics, Plant Sciences Institute, Iowa State University, Ames, Iowa 50011-3020
Department of Biochemistry, Biophysics, and Molecular Biology, Iowa State University, Ames, Iowa 50011-3020
(Received: 16 August 2004; accepted: 1 October 2004; published online: 16 December 2004)We estimate the statistical distribution of relative orientations between contacting residues from a database of protein structures and evaluate the potential of mean force for relative orientations between contacting residues. Polar angles and Euler angles are used to specify two degrees of directional freedom and three degrees of rotational freedom for the orientation of one residue relative to another in contacting residues, respectively. A local coordinate system affixed to each residue based only on main chain atoms is defined for fold recognition. The number of contacting residue pairs in the database will severely limit the resolution of the statistical distribution of relative orientations, if it is estimated by dividing space into cells and counting samples observed in each cell. To overcome such problems and to evaluate the fully anisotropic distributions of relative orientations as a function of polar and Euler angles, we choose a method in which the observed distribution is represented as a sum of  functions each of which represents the observed orientation of a contacting residue, and is evaluated as a series expansion of spherical harmonics functions. The sample size limits the frequencies of modes whose expansion coefficients can be reliably estimated. High frequency modes are statistically less reliable than low frequency modes. Each expansion coefficient is separately corrected for the sample size according to suggestions from a Bayesian statistical analysis. As a result, many expansion terms can be utilized to evaluate orientational distributions. Also, unlike other orientational potentials, the uniform distribution is used for a reference distribution in evaluating a potential of mean force for each type of contacting residue pair from its orientational distribution, so that residue-residue orientations can be fully evaluated. It is shown by using decoy sets that the discrimination power of the orientational potential in fold recognition increases by taking account of the Euler angle dependencies and becomes comparable to that of a simple contact potential, and that the total energy potential taken as a simple sum of contact, orientation, and (
 ,
, ) potentials performs well to identify the native folds.© 2005 American Institute of Physics.
Contents
I. INTRODUCTION
For the past ten years, there have been many attempts1–35 to develop coarse-grained scoring potentials that can identify native structures from non-native folds.36,37,38,39 These simplified potentials are useful in studies of protein structural prediction40,41,42,43 and protein dynamics and folding mechanism28,29,44 because it is computationally difficult to use all-atom molecular dynamics simulations for these purposes.
The idea of using residue-residue contact frequencies to represent contact preferences between amino acids was proposed first by Tanaka and Scheraga,1 and a contact potential2,3,4 for each type of amino acid pair at a residue level was evaluated in the Bethe approximation under the assumption that protein structures can be regarded as a mixture of disconnected residues in statistical equilibrium. Sippl8 introduced a distance dependency into a pair potential and evaluated it as a potential of mean force. Score functions at an atomic level were also devised.11,12,13,14,18 The capabilities of pairwise score functions to identify native structures from non-native folds have been examined by those optimizations,19,20,21,22,23,24,25 and it was reported that it is impossible to make a pairwise potential21 and even a distance-dependent potential23,24 to identify all native structures. Multibody potentials have also been derived and the importance of multibody interactions have been pointed out.28,29,30,31 Liwo et al.32 developed a general method to derive multibody terms in a potential of mean force.
On the other hand, the importance of specific coordinations between residues in protein structures was pointed out by Bahar and Jernigan.45 Liwo et al.15,16 developed a united-residue force field that is both radial and anisotropic. The united-residue force field was determined by parameterizing physically reasonable functional forms of potentials of mean force for side chain interactions. Each side chain was represented by an ellipsoid and the relative orientation between side chains was described by three angles. The interactions between side chains were parameterized as van der Waals potentials. Buchete et al.34,35 also attempted to develop anisotropic statistical potentials from the observed distribution of relative residue-residue orientations in known protein structures. To represent the orientation of one residue relative to another, three degrees of translational freedom and three degrees of rotational freedom must be specified. A polar coordinate system and Euler angles can be used to specify the three degrees of translational freedom and the three degrees of rotational freedom, respectively. In their potentials, only radial distance and polar angle dependencies of relative residue-residue orientations are taken into account but Euler angle dependences of the orientations were not explicitly taken into account, probably because of the limited size of samples. Onizuka et al.33 attempted to estimate a fully anisotropic distance-dependent potential, which is a function of radial distance, polar, and also Euler angles, for each type of residue pair, although they could not achieve any improvement in the discrimination power of their score function by taking account of Euler angle dependencies. These analyses indicate the importance of residue-residue orientations in residue-residue interactions.
Here the fully anisotropic distributions of relative orientations between contacting residues are estimated as a function of polar and Euler angles from known protein structures. Those Euler angle dependencies and correlations between polar and Euler angles are analyzed as well as polar angle dependencies.
For evaluation of the frequency distribution of residue-residue orientations, we did not use a method of dividing space into many cells and counting samples observed in each cell, but instead employed the method proposed by Onizuka et al.33 in which the observed distribution of residue-residue orientations is represented as a sum of functions each of which represents the observed location in angular space, and then is estimated in the form of a series expansion with spherical harmonics functions, ignoring high frequency modes that occur, because of the sample size. High frequency modes are statistically less reliable than low frequency modes. Here, unlike other works33,34,35 each expansion term is separately corrected for the sample size according to suggestions from an analysis of Bayesian statistics. As a result, many expansion terms can be utilized to evaluate orientational distributions. A local coordinate system for each residue is defined for fold recognition, based only on main chain atoms to represent directional and rotational relationships between the main chains of contacting residues rather than between the side chains.33,34,35 Results show that a large contribution to the orientational entropy of residue pairs comes from the Euler angle dependencies of the frequency distribution and also from the polar and Euler angle correlations. Then, an energy potential for relative orientations of contacting residues is evaluated for each type of amino acid pair as a potential of mean force from the estimated distributions.
A reference state is also defined differently from other works.33,34,35 A reference distribution for each type of amino acid pair is the uniform distribution rather than the overall distribution for all types of amino acid pairs employed by other works,33,34,35 so that residue-residue orientations can be fully evaluated. The overall distribution may be one of the important characteristics to distinguish proteinlike structures from others, because the overall distribution observed in native structures is not known to be characteristic of non-native conformations. The zero energy level of the orientational potential for each residue pair type is defined such that the expected value of orientational energy for the native folds is equal to zero for each type of contacting residue pair. Therefore, this orientational potential represents simply the suitability of a given relative orientation between contacting residues. Also, this orientational potential can be used without any modification as a scoring function for optimum sequence designs and sequence-structure alignments in which deletions and additions of amino acids are allowed.7
It is shown that the discrimination performance of the orientational potential in fold recognition is significantly improved by taking account of Euler angle dependencies and the performance of a total energy potential consisting of a long-range contact potential and a short-range secondary structure potential is improved by taking account of the orientational potential as an additional term.
II. METHODS
A. Coarse-grained conformational energy
A conformational potential, which will be used for fold recognition, is represented as the sum of coarse-grained long-range El and short-range Es potentials. The long-range potential has two terms, a contact energy Ec reflecting contact frequencies in crystal structures and a repulsive energy Er to penalize overly dense packing

The short-range potential is a secondary structure potential based on peptide dihedral angles. All of these potentials are estimated as potentials of mean force from the observed distributions of residue-residue contacts and of peptide dihedral angles at the residue level in crystal structures of proteins. In the following, energy is represented in kBT units, where kB is the Boltzmann constant and T is temperature.
B. Contact potentials
The total contact energy is defined here as the sum of all pairwise energies between residues,
![<i>E</i><sup><i>c</i></sup> = (1/2) [summation]<sub><i>i</i></sub>[summation]<sub><i>j</i> [not-equal] <i>i</i></sub><i>e</i><sup><i>c</i></sup>(<b>r</b><sub><i>i</i></sub>,<b>r</b><sub><i>j</i></sub>),](024901_1_files/024901_1m1.gif)
where ec(ri,rj) is the contact energy between the ith and jth residues, and ri represents all the atomic positions of the ith residue. The pairwise energy potential is represented as the sum of two terms, one of which is the usual contact potential2,3,4 and the other is a potential of mean force for relative orientations between contacting residues that is evaluated here from the statistical distribution of relative orientations,
![<i>e</i><sup><i>c</i></sup>(<b>r</b><sub><i>i</i></sub>,<b>r</b><sub><i>j</i></sub>) = <i>Delta</i><sup><i>c</i></sup>(<b>r</b><sub><i>i</i></sub>,<b>r</b><sub><i>j</i></sub>)[<i>e</i><sub><i>a</i><sub><i>i</i></sub><i>a</i><sub><i>j</i></sub></sub><sup><i>c</i></sup> + <i>e</i><sub><i>a</i><sub><i>i</i></sub><i>a</i><sub><i>j</i></sub></sub><sup><i>o</i></sup>(<b>r</b><sub><i>i</i></sub>,<b>r</b><sub><i>j</i></sub>)],](024901_1_files/024901_1m2.gif)
where  c(ri,rj) represents the degree of contact between the ith and jth residues, e
 is the contact energy for residues of types ai and aj in contact, and eoaiaj(ri,rj) is the orientational energy for the relative direction and rotation between amino acids of type ai and aj contact; ai means the amino acid type of the ith residue. Here, it should be noted that the radial distance between residues is described by specifying whether or not these residues are in contact with each other, and that orientational interactions are assumed only for residues that are in contact with each other.
c(ri,rj) takes a value one for residues that are completely in contact, the value zero for residues that are too far from each other, and values between one and zero for residues whose distance is intermediate between those two extremes, about 6.5 Ĺ between geometric centers of their side chain heavy atoms. Previously, this function was defined as a step function for simplicity. Here, it is defined as a switching function as follows; in the equation below to define residue contacts, ri means the position vector of a geometric center of side chain heavy atoms or the C atom for GLY,
![<i>Delta</i><sup><i>c</i></sup>(<b>r</b><sub><i>i</i></sub>,<b>r</b><sub><i>j</i></sub>) [equivalent] 1.0,–<i>S</i><sub><i>w</i></sub>[|<b>r</b><sub><i>i</i></sub> – <b>r</b><sub><i>j</i></sub>|,<i>d</i><sub>1</sub><sup><i>c</i></sup>(<i>r</i><sub><i>a</i><sub><i>i</i></sub></sub><sup>vdw</sup> + <i>r</i><sub><i>a</i><sub><i>j</i></sub></sub><sup>vdw</sup>),<i>d</i><sub>2</sub><sup><i>c</i></sup>(<i>r</i><sub><i>a</i><sub><i>i</i></sub></sub><sup>vdw</sup> + <i>r</i><sub><i>a</i><sub><i>j</i></sub></sub><sup>vdw</sup>)],](024901_1_files/024901_1m4.gif)
![<i>d</i><sub>1</sub><sup><i>c</i></sup>(<i>x</i>) [equivalent] {(6.5 × 0.95, for <i>x</i> <= 6.5 × 0.95; <i>x</i>, otherwise),](024901_1_files/024901_1m5.gif)
![<i>d</i><sub>2</sub><sup><i>c</i></sup>(<i>x</i>) [equivalent] 1.05<i>d</i><sub>1</sub><sup><i>c</i></sup>(<i>x</i>)/0.95,](024901_1_files/024901_1m6.gif)
![<i>S</i><sub><i>w</i></sub>(<i>x</i>,<i>a</i>,<i>b</i>) [equivalent] {(1 for <i>x</i> <= <i>a</i>; [(<i>b</i><sup>2</sup> – <i>x</i><sup>2</sup>)<sup>2</sup>/(<i>b</i><sup>2</sup> – <i>a</i><sup>2</sup>)<sup>3</sup>][3(<i>b</i><sup>2</sup> – <i>a</i><sup>2</sup>); – 2(<i>b</i><sup>2</sup> – <i>x</i><sup>2</sup>)] for <i>a</i> < <i>x</i> < <i>b</i>; 0 for <i>b</i> <= <i>x</i>; ),](024901_1_files/024901_1m7.gif)
![<i>r</i><sub><i>a</i></sub><sup>vdw</sup> = [((3 <i>rho</i> <i>V</i><sub><i>a</i></sub>)/(4 <i>pi</i>))]<sup>1/3</sup>,](024901_1_files/024901_1m8.gif)
![<i>rho</i> = ((<i>pi</i>)/(3[square root of 2])),](024901_1_files/024901_1m9.gif)
where Sw is a switching function, and r is the van der Waals radius of a residue of type a which is estimated from the average volume Va occupied by a residue of type a in protein structures with the packing density of hard sphere
  ; Va are those calculated in Refs. 46 and 47 and listed in Ref. 2. A critical distance to define a residue-residue contact is about 6.5 Ĺ, but it is taken to be larger for bulky residues.
Pairwise contact energies are defined as the sum of collapse energy e and a residue-type dependent term e
![<sub><i>a</i><i>a</i><sup>[prime]</sup></sub><sup><i>c</i></sup>](024901_1_files/024901_1m12.gif) ; r means an average residue here.
; r means an average residue here.
![<i>e</i><sub><i>a</i><i>a</i><sup>[prime]</sup></sub><sup><i>c</i></sup> = <i>Delta</i> <i>e</i><sub><i>a</i><i>a</i><sup>[prime]</sup></sub><sup><i>c</i></sup> + <i>e</i><sub><i>r</i><i>r</i></sub><sup><i>c</i></sup>.](024901_1_files/024901_1m13.gif)
The energies e for all pairs of the 20 types of residues were recalculated44 from 2129 protein species representatives of the SCOP48 Release 1.53 with the sampling method3 and with the parameters evaluated in Miyazawa and Jernigan4 to correct these values estimated by the Bethe approximation; actually, the estimates of contact energies corrected for the Bethe approximation are divided by 
![[prime]](024901_1_files/prime-script.gif)
 0.263 defined in Eq. (34) of that paper4 and used as the values of e. In other words, the intrinsic pairwise interaction energies eij are corrected relative to the hydrophobic energies eir, and the hydrophobic energies are not corrected at all; see that paper4 for the exact definitions of eij and eir. This scheme is employed, so that all the energy potentials in Eq. (1) have magnitudes estimated as the potential of mean force from observed distributions by assuming a Boltzmann distribution.
The collapse energy e is essential for a protein to fold by canceling out the large conformational entropy of extended conformations but it is difficult to estimate.2,3 The value –2.55 originally estimated2,3 for e is used here; as a result, the contact energy e takes a negative value for all amino acid pairs except for LYS-LYS pair.
C. Residue-residue orientational potential
In the representation of the relative location of one residue with respect to another three degrees of translational freedom and three degrees of rotational freedom must be specified. Here, distances between residues are described by specifying whether or not those residues are in contact with each other. Thus, for contacting residue pairs, two degrees of directional freedom and three degrees of rotational freedom are needed to represent those relative locations. Let us use polar angles ( ,) and Euler angles (
 ,
, ,
, ) to describe the direction and rotation of one residue relative to another, respectively. A local coordinate system fixed on each residue will be defined later. The potential of mean force for residue orientations is defined as
![<i>e</i><sub><i>a</i><i>a</i><sup>[prime]</sup></sub><sup><i>o</i></sup> = (1/2)[{–ln <i>f</i><sub><i>a</i><i>a</i><sup>[prime]</sup></sub> + <ln <i>f</i><sub><i>a</i><i>a</i><sup>[prime]</sup></sub>>} + {–ln <i>f</i><sub><i>a</i><sup>[prime]</sup><i>a</i></sub> + <ln <i>f</i><sub><i>a</i><sup>[prime]</sup><i>a</i></sub>>}],](024901_1_files/024901_1m14.gif)
![<i>f</i><sub><i>a</i><i>a</i><sup>[prime]</sup></sub> [equivalent] <i>f</i><sub><i>a</i><i>a</i><sup>[prime]</sup></sub>(<i>theta</i>,<i>phi</i>,<i>Theta</i>,<i>Phi</i>,<i>Psi</i>),](024901_1_files/024901_1m15.gif)
![<i>f</i><sub><i>a</i><sup>[prime]</sup><i>a</i></sub> [equivalent] <i>f</i><sub><i>a</i><sup>[prime]</sup><i>a</i></sub>(<i>theta</i><sup>[prime]</sup>,<i>phi</i><sup>[prime]</sup>,<i>Theta</i><sup>[prime]</sup>,<i>Phi</i><sup>[prime]</sup>,<i>Psi</i><sup>[prime]</sup>),](024901_1_files/024901_1m16.gif)
where faa(,,,,) is a probability density function for a residue of type a at the orientation (,,,,) relative to the residue of type a; it satisfies
![[integral]<i>f</i><sub><i>a</i><i>a</i><sup>[prime]</sup></sub>(<i>theta</i>,<i>phi</i>,<i>Theta</i>,<i>Phi</i>,<i>Psi</i>)<i>d</i> cos <i>theta</i> <i>d</i> <i>phi</i> <i>d</i> cos <i>Theta</i> <i>d</i> <i>Phi</i> <i>d</i> <i>Psi</i> = 1.](024901_1_files/024901_1m17.gif)
An obvious relationship between the Euler angles exists for the distribution of residue orientations between faa and faa:
![<i>Theta</i><sup>[prime]</sup> = –<i>Theta</i>, <i>Phi</i><sup>[prime]</sup> = –<i>Psi</i>, <i>Psi</i><sup>[prime]</sup> = –<i>Phi</i>.](024901_1_files/024901_1m18.gif)
The relationship in respect to the polar angles (,) is not simple, but (,) can be uniquely calculated from (,,,,). Thus, in principle, faa and faa must be equal to each other:
![<i>f</i><sub><i>a</i><i>a</i><sup>[prime]</sup></sub>(<i>theta</i>,<i>phi</i>,<i>Theta</i>,<i>Phi</i>,<i>Psi</i>) = <i>f</i><sub><i>a</i><sup>[prime]</sup><i>a</i></sub>(<i>theta</i><sup>[prime]</sup>,<i>phi</i><sup>[prime]</sup>,<i>Theta</i><sup>[prime]</sup>,<i>Phi</i><sup>[prime]</sup>,<i>Psi</i><sup>[prime]</sup>).](024901_1_files/024901_1m19.gif)
However, in the present statistical estimation of the probability density, the relationship above would be approximately satisfied. Therefore, the potential is evaluated in the form of Eq. (11).
The second and the fourth terms in Eq. (11), each of which is the orientational entropy in kB units, are calculated as
![<–ln <i>f</i><sub><i>a</i><i>a</i><sup>[prime]</sup></sub>(<i>theta</i>,<i>phi</i>,<i>Theta</i>,<i>Phi</i>,<i>Psi</i>)> [equivalent] [integral] – <i>f</i><sub><i>a</i><i>a</i><sup>[prime]</sup></sub> ln <i>f</i><sub><i>a</i><i>a</i><sup>[prime]</sup></sub><i>d</i> cos <i>theta</i> <i>d</i> <i>phi</i> <i>d</i> cos <i>Theta</i> <i>d</i> <i>Phi</i> <i>d</i> <i>Psi</i>.](024901_1_files/024901_1m20.gif)
Here it is important to note that this term represents a reference state such that the expected value of the orientational energy for each type of contacting residue pair in the native structures is equal to zero. Thus, this orientational potential represents simply the suitability of a relative orientation between contacting residues, but does not represent at all whether a contact between residues is favorable or not. The latter is supposed to be represented in the present scheme by the usual contact energy e. The reference distribution of residue-residue orientations for these orientational potentials is the uniform distribution, and not the overall distribution for all types of amino acid pairs employed by others.33,34,35 Therefore, for residue pairs whose distributions coincide with the overall distribution, the latter potentials give always no preference but the present potentials give a preference. This is a desirable behavior for orientational potentials, because such an overall distribution of residue-residue orientations would not be an intrinsic characteristic of non-native conformations but rather of native structures of proteins.
Instead of directly evaluating the frequency distributions of relative residue-residue orientations in angular space, we estimate it with a series expansion in spherical harmonics functions. The use of spherical harmonics functions to represent orientational distributions of residue-residue pairs was attempted by Onizuka et al.33 and Buchete et al.34,35 The probability density is expanded as follows in the series of spherical harmonics functions which makes a complete orthonormal system with the (,,,,) variables.
![<i>f</i><sub><i>a</i><i>a</i><sup>[prime]</sup></sub>(<i>theta</i>,<i>phi</i>,<i>Theta</i>,<i>Phi</i>,<i>Psi</i>) = [summation]<sub><i>l</i><sub><i>p</i></sub> = 0</sub>[summation]<sub><i>m</i><sub><i>p</i></sub> = –<i>l</i><sub><i>p</i></sub></sub><sup><i>l</i><sub><i>p</i></sub></sup>[summation]<sub><i>l</i><sub><i>e</i></sub> = 0</sub>[summation]<sub><i>m</i><sub><i>e</i></sub> = –<i>l</i><sub><i>e</i></sub></sub><sup><i>l</i><sub><i>e</i></sub></sup>[summation]<sub><i>k</i><sub><i>e</i></sub></sub><i>c</i><sub><i>l</i><sub><i>p</i></sub><i>m</i><sub><i>p</i></sub><i>l</i><sub><i>e</i></sub><i>m</i><sub><i>e</i></sub><i>k</i><sub><i>e</i></sub></sub><sup><i>a</i><i>a</i><sup>[prime]</sup></sup><i>g</i><sub><i>l</i><sub><i>p</i></sub><i>m</i><sub><i>p</i></sub><i>l</i><sub><i>e</i></sub><i>m</i><sub><i>e</i></sub><i>k</i><sub><i>e</i></sub></sub>(<i>theta</i>,<i>phi</i>,<i>Theta</i>,<i>Phi</i>,<i>Psi</i>),](024901_1_files/024901_1m21.gif)
g is represented as
![<i>g</i><sub><i>l</i><sub><i>p</i></sub><i>m</i><sub><i>p</i></sub><i>l</i><sub><i>e</i></sub><i>m</i><sub><i>e</i></sub><i>k</i><sub><i>e</i></sub></sub> [equivalent] <i>Y</i><sub><i>l</i><sub><i>p</i></sub></sub><sup><i>m</i><sub><i>p</i></sub></sup>(cos <i>theta</i>,<i>phi</i>)<i>Y</i><sub><i>l</i><sub><i>e</i></sub></sub><sup><i>m</i><sub><i>e</i></sub></sup>(cos <i>Theta</i>,<i>Phi</i>)<i>R</i><sub><i>k</i><sub><i>e</i></sub></sub>(<i>Psi</i>),](024901_1_files/024901_1m22.gif)
![<i>Y</i><sub><i>l</i></sub><sup><i>m</i></sup>(cos <i>theta</i>,<i>phi</i>) = [(((2<i>l</i> + 1)(<i>l</i> – |<i>m</i>|)!)/(2(<i>l</i> + |<i>m</i>|)!))]<sup>1/2</sup><i>P</i><sub><i>l</i></sub><sup>|<i>m</i>|</sup>(cos <i>theta</i>)<i>R</i><sub><i>m</i></sub>(<i>phi</i>),](024901_1_files/024901_1m23.gif)
where Y is the normalized spherical harmonics function, P
 is the associated Legendre function; P
 with mp = 0 is the Legendre polynomial. Then, the coefficients in the expansion of Eq. (18) can be calculated from the observed density distribution by
![<i>c</i><sub><i>l</i><sub><i>p</i></sub><i>m</i><sub><i>p</i></sub><i>l</i><sub><i>e</i></sub><i>m</i><sub><i>e</i></sub><i>k</i><sub><i>e</i></sub></sub><sup><i>a</i><i>a</i><sup>[prime]</sup></sup> = [integral]<i>f</i><sub><i>a</i><i>a</i><sup>[prime]</sup></sub><i>g</i><sub><i>l</i><sub><i>p</i></sub><i>m</i><sub><i>p</i></sub><i>l</i><sub><i>e</i></sub><i>m</i><sub><i>e</i></sub><i>k</i><sub><i>e</i></sub></sub><i>d</i> cos <i>theta</i> <i>d</i> <i>phi</i> <i>d</i> cos <i>Theta</i> <i>d</i> <i>Phi</i> <i>d</i> <i>Psi</i>.](024901_1_files/024901_1m28.gif)
Thus, the coefficient of the first constant term in Eq. (18) that corresponds to the uniform distribution is obvious;
![<i>c</i><sub>00000</sub><sup><i>a</i><i>a</i><sup>[prime]</sup></sup> = (1/(2(2 <i>pi</i>)<sup>3/2</sup>)).](024901_1_files/024901_1m29.gif)
Buchete et al.34,35 employed spherical harmonics functions only for smoothing the frequency distributions of residue-residue relative orientations observed in angular coordinate space. However, to estimate the expansion coefficients, the formal representation of an observed probability function with the function can be used,33 that is,
![<i>f</i><sub><i>a</i><i>a</i><sup>[prime]</sup></sub><sup><i>o</i><i>b</i><i>s</i></sup>(<i>theta</i>,<i>phi</i>,<i>Theta</i>,<i>Phi</i>,<i>Psi</i>) = (1/<i>N</i><sub><i>a</i><i>a</i><sup>[prime]</sup></sub>) [summation]<sub><i>µ</i> [is-an-element-of] {(<i>a</i><i>a</i><sup>[prime]</sup>)}</sub><i>w</i><sub><i>µ</i></sub><i>delta</i>(cos <i>theta</i> – cos <i>theta</i><sub><i>µ</i></sub>)<i>delta</i>(<i>phi</i> – <i>phi</i><sub><i>µ</i></sub>)<i>delta</i>(cos <i>Theta</i> – cos <i>Theta</i><sub><i>µ</i></sub>)<i>delta</i>(<i>Phi</i> – <i>Phi</i><sub><i>µ</i></sub>)<i>delta</i>(<i>Psi</i> – <i>Psi</i><sub><i>µ</i></sub>),](024901_1_files/024901_1m30.gif)
![<i>N</i><sub><i>a</i><i>a</i><sup>[prime]</sup></sub> = [summation]<sub><i>µ</i> [is-an-element-of] {(<i>a</i><i>a</i><sup>[prime]</sup>)}</sub><i>w</i><sub><i>µ</i></sub>,](024901_1_files/024901_1m31.gif)
and then, the expansion coefficients are calculated as
![<i>c</i><sub><i>l</i><sub><i>p</i></sub><i>m</i><sub><i>p</i></sub><i>l</i><sub><i>e</i></sub><i>m</i><sub><i>e</i></sub><i>k</i><sub><i>e</i></sub></sub><sup><i>a</i><i>a</i><sup>[prime]</sup></sup> = (1/<i>N</i><sub><i>a</i><i>a</i><sup>[prime]</sup></sub>) [summation]<sub><i>µ</i> [is-an-element-of] {(<i>a</i><i>a</i><sup>[prime]</sup>)}</sub><i>w</i><sub><i>µ</i></sub><i>g</i><sub><i>l</i><sub><i>p</i></sub><i>m</i><sub><i>p</i></sub><i>l</i><sub><i>e</i></sub><i>m</i><sub><i>e</i></sub><i>k</i><sub><i>e</i></sub></sub>(<i>theta</i><sub><i>µ</i></sub>,<i>phi</i><sub><i>µ</i></sub>,<i>Theta</i><sub><i>µ</i></sub>,<i>Phi</i><sub><i>µ</i></sub>,<i>Psi</i><sub><i>µ</i></sub>),](024901_1_files/024901_1m32.gif)
where (µ,µ,µ,µ,µ) is a set of angles observed for the contact µ between residue types a and a, and wµ is a weight for this contact. The summations in the equations above are over all contacts of amino acid types a versus a. A contact between amino acid types a and a is counted as one half of a contact for a versus a and another half for a versus a; Naa + Naa is equal to the actual number of contacts between amino acid types a and a. Thus, a weight wµ is equal to 0.5wc, where wc is a sampling weight for each protein that is described in the section "Datasets of protein structures used." In Eq. (24), residues are regarded to be in contact if the geometric centers of side chains or C atoms for GLY are within 6.5 Ĺ.
The sample size limits the frequencies of those modes whose expansion coefficients can be reliably estimated. High order terms are less reliably estimated than the low order terms. Bayesian statistical analysis suggests using "pseudo counts" for expected occurrences of residue pairs.8,49 As a result, the expansion coefficients of the observed distribution are estimated as follows:
![<i>c</i><sub><i>l</i><sub><i>p</i></sub><i>m</i><sub><i>p</i></sub><i>l</i><sub><i>e</i></sub><i>m</i><sub><i>e</i></sub><i>k</i><sub><i>e</i></sub></sub><sup><i>a</i><i>a</i><sup>[prime]</sup></sup> [approximate] (1/(1 + <i>beta</i><sub><i>l</i><sub><i>p</i></sub><i>m</i><sub><i>p</i></sub><i>l</i><sub><i>e</i></sub><i>m</i><sub><i>e</i></sub><i>k</i><sub><i>e</i></sub></sub><sup><i>a</i><i>a</i><sup>[prime]</sup></sup>)) [<i>beta</i><sub><i>l</i><sub><i>p</i></sub><i>m</i><sub><i>p</i></sub><i>l</i><sub><i>e</i></sub><i>m</i><sub><i>e</i></sub><i>k</i><sub><i>e</i></sub></sub><sup><i>a</i><i>a</i><sup>[prime]</sup></sup><i>c</i><sub><i>l</i><sub><i>p</i></sub><i>m</i><sub><i>p</i></sub><i>l</i><sub><i>e</i></sub><i>m</i><sub><i>e</i></sub><i>k</i><sub><i>e</i></sub></sub><sup><i>a</i><i>r</i></sup>+(1/<i>N</i><sub><i>a</i><i>a</i><sup>[prime]</sup></sub>) [summation]<sub><i>µ</i> [is-an-element-of] {(<i>a</i><i>a</i><sup>[prime]</sup>)}</sub><i>w</i><sub><i>µ</i></sub><i>g</i><sub><i>l</i><sub><i>p</i></sub><i>m</i><sub><i>p</i></sub><i>l</i><sub><i>e</i></sub><i>m</i><sub><i>e</i></sub><i>k</i><sub><i>e</i></sub></sub>(<i>theta</i><sub><i>µ</i></sub>,<i>phi</i><sub><i>µ</i></sub>,<i>Theta</i><sub><i>µ</i></sub>,<i>Phi</i><sub><i>µ</i></sub>,<i>Psi</i><sub><i>µ</i></sub>)],](024901_1_files/024901_1m33.gif)
![<i>c</i><sub><i>l</i><sub><i>p</i></sub><i>m</i><sub><i>p</i></sub><i>l</i><sub><i>e</i></sub><i>m</i><sub><i>e</i></sub><i>k</i><sub><i>e</i></sub></sub><sup><i>a</i><i>r</i></sup> [approximate] (1/(1 + <i>beta</i><sub><i>l</i><sub><i>p</i></sub><i>m</i><sub><i>p</i></sub><i>l</i><sub><i>e</i></sub><i>m</i><sub><i>e</i></sub><i>k</i><sub><i>e</i></sub></sub><sup><i>a</i><i>r</i></sup>)) [<i>beta</i><sub><i>l</i><sub><i>p</i></sub><i>m</i><sub><i>p</i></sub><i>l</i><sub><i>e</i></sub><i>m</i><sub><i>e</i></sub><i>k</i><sub><i>e</i></sub></sub><sup><i>a</i><i>r</i></sup><i>c</i><sub><i>l</i><sub><i>p</i></sub><i>m</i><sub><i>p</i></sub><i>l</i><sub><i>e</i></sub><i>m</i><sub><i>e</i></sub><i>k</i><sub><i>e</i></sub></sub><sup><i>r</i><i>r</i></sup>+(1/<i>N</i><sub><i>a</i><i>r</i></sub>) [summation]<sub><i>µ</i> [is-an-element-of] {(<i>a</i><i>r</i>)}</sub><i>w</i><sub><i>µ</i></sub><i>g</i><sub><i>l</i><sub><i>p</i></sub><i>m</i><sub><i>p</i></sub><i>l</i><sub><i>e</i></sub><i>m</i><sub><i>e</i></sub><i>k</i><sub><i>e</i></sub></sub>(<i>theta</i><sub><i>µ</i></sub>,<i>phi</i><sub><i>µ</i></sub>,<i>Theta</i><sub><i>µ</i></sub>,<i>Phi</i><sub><i>µ</i></sub>,<i>Psi</i><sub><i>µ</i></sub>)],](024901_1_files/024901_1m34.gif)
![<i>c</i><sub><i>l</i><sub><i>p</i></sub><i>m</i><sub><i>p</i></sub><i>l</i><sub><i>e</i></sub><i>m</i><sub><i>e</i></sub><i>k</i><sub><i>e</i></sub></sub><sup><i>r</i><i>a</i><sup>[prime]</sup></sup> [approximate] (1/(1 + <i>beta</i><sub><i>l</i><sub><i>p</i></sub><i>m</i><sub><i>p</i></sub><i>l</i><sub><i>e</i></sub><i>m</i><sub><i>e</i></sub><i>k</i><sub><i>e</i></sub></sub><sup><i>r</i><i>a</i><sup>[prime]</sup></sup>)) [<i>beta</i><sub><i>l</i><sub><i>p</i></sub><i>m</i><sub><i>p</i></sub><i>l</i><sub><i>e</i></sub><i>m</i><sub><i>e</i></sub><i>k</i><sub><i>e</i></sub></sub><sup><i>r</i><i>a</i><sup>[prime]</sup></sup><i>c</i><sub><i>l</i><sub><i>p</i></sub><i>m</i><sub><i>p</i></sub><i>l</i><sub><i>e</i></sub><i>m</i><sub><i>e</i></sub><i>k</i><sub><i>e</i></sub></sub><sup><i>r</i><i>r</i></sup>+(1/<i>N</i><sub><i>r</i><i>a</i><sup>[prime]</sup></sub>) [summation]<sub><i>µ</i> [is-an-element-of] {(<i>r</i><i>a</i><sup>[prime]</sup>)}</sub><i>w</i><sub><i>µ</i></sub><i>g</i><sub><i>l</i><sub><i>p</i></sub><i>m</i><sub><i>p</i></sub><i>l</i><sub><i>e</i></sub><i>m</i><sub><i>e</i></sub><i>k</i><sub><i>e</i></sub></sub>(<i>theta</i><sub><i>µ</i></sub>,<i>phi</i><sub><i>µ</i></sub>,<i>Theta</i><sub><i>µ</i></sub>,<i>Phi</i><sub><i>µ</i></sub>,<i>Psi</i><sub><i>µ</i></sub>)],](024901_1_files/024901_1m35.gif)
![<i>c</i><sub><i>l</i><sub><i>p</i></sub><i>m</i><sub><i>p</i></sub><i>l</i><sub><i>e</i></sub><i>m</i><sub><i>e</i></sub><i>k</i><sub><i>e</i></sub></sub><sup><i>r</i><i>r</i></sup> [approximate] (1/(1 + <i>beta</i><sub>00000</sub><sup><i>r</i><i>r</i></sup>)) [<i>beta</i><sub>00000</sub><sup><i>r</i><i>r</i></sup><i>c</i><sub>00000</sub><sup><i>r</i><i>r</i></sup><i>delta</i><sub>0<i>l</i><sub><i>p</i></sub></sub><i>delta</i><sub>0<i>m</i><sub><i>p</i></sub></sub><i>delta</i><sub>0<i>l</i><sub><i>e</i></sub></sub><i>delta</i><sub>0<i>m</i><sub><i>p</i></sub></sub><i>delta</i><sub>0<i>k</i><sub><i>e</i></sub></sub>+(1/<i>N</i><sub><i>r</i><i>r</i></sub>) [summation]<sub><i>µ</i> [is-an-element-of] {(<i>r</i><i>r</i>)}</sub><i>w</i><sub><i>µ</i></sub><i>g</i><sub><i>l</i><sub><i>p</i></sub><i>m</i><sub><i>p</i></sub><i>l</i><sub><i>e</i></sub><i>m</i><sub><i>e</i></sub><i>k</i><sub><i>e</i></sub></sub>(<i>theta</i><sub><i>µ</i></sub>,<i>phi</i><sub><i>µ</i></sub>,<i>Theta</i><sub><i>µ</i></sub>,<i>Phi</i><sub><i>µ</i></sub>,<i>Psi</i><sub><i>µ</i></sub>)],](024901_1_files/024901_1m36.gif)
where 
![<sub><i>l</i><sub><i>p</i></sub><i>m</i><sub><i>p</i></sub><i>l</i><sub><i>e</i></sub><i>m</i><sub><i>e</i></sub><i>k</i><sub><i>e</i></sub></sub><sup><i>a</i><i>a</i><sup>[prime]</sup></sup>](024901_1_files/024901_1m37.gif) is taken to be
is taken to be
![<i>beta</i><sub><i>l</i><sub><i>p</i></sub><i>m</i><sub><i>p</i></sub><i>l</i><sub><i>e</i></sub><i>m</i><sub><i>e</i></sub><i>k</i><sub><i>e</i></sub></sub><sup><i>a</i><i>a</i><sup>[prime]</sup></sup> [equivalent] ((<i>beta</i> <i>O</i><sub><i>l</i><sub><i>p</i></sub><i>m</i><sub><i>p</i></sub><i>l</i><sub><i>e</i></sub><i>m</i><sub><i>e</i></sub><i>k</i><sub><i>e</i></sub></sub>)/<i>N</i><sub><i>a</i><i>a</i><sup>[prime]</sup></sub>),](024901_1_files/024901_1m38.gif)
![<i>O</i><sub><i>l</i><sub><i>p</i></sub><i>m</i><sub><i>p</i></sub><i>l</i><sub><i>e</i></sub><i>m</i><sub><i>e</i></sub><i>k</i><sub><i>e</i></sub></sub> [equivalent] [the number of frequency modes lower than or equal to (<i>l</i><sub><i>p</i></sub>,<i>m</i><sub><i>p</i></sub>,<i>l</i><sub><i>e</i></sub>,<i>m</i><sub><i>e</i></sub>,<i>k</i><sub><i>e</i></sub>)] = (<i>l</i><sub><i>p</i></sub><sup>2</sup> + 2|<i>m</i><sub><i>p</i></sub>| + 1)(<i>l</i><sub><i>e</i></sub><sup>2</sup> + 2|<i>m</i><sub><i>e</i></sub>| + 1)(2|<i>k</i><sub><i>e</i></sub>| + 1),](024901_1_files/024901_1m39.gif)
in order to reduce statistical errors resulting from the small size of samples; in Eq. (31) is a parameter to be optimized. Equation (31) means that more samples are required to determine higher frequency modes. In Eq. (27), the first term becomes more effective than the second term in the limit of small numbers of Naa, and inversely the second term becomes more effective than the first term in the limit of large numbers of Naa.
Then, higher order terms in Eq. (18), which tend to reflect artificial contributions from the small size of samples, are ignored by evaluating only the lower order terms with

and

where Ocutoff is a cutoff value for expansion terms.
In order to reduce the number of expansion terms, we choose only terms in the expansion whose coefficients have absolute values larger than a certain cutoff value. Thus, the probability density function is evaluated as
![<i>f</i><sub><i>a</i><i>a</i><sup>[prime]</sup></sub>(<i>theta</i>,<i>phi</i>,<i>Theta</i>,<i>Phi</i>,<i>Psi</i>) [approximate] [summation]<sub><i>l</i><sub><i>p</i></sub> = 0</sub><sup><i>l</i><sub><i>p</i></sub><sup>max</sup></sup>[summation]<sub><i>m</i><sub><i>p</i></sub> = –<i>l</i><sub><i>p</i></sub></sub><sup><i>l</i><sub><i>p</i></sub></sup>[summation]<sub><i>l</i><sub><i>e</i></sub> = 0</sub><sup><i>l</i><sub><i>e</i></sub><sup>max</sup></sup>[summation]<sub><i>m</i><sub><i>e</i></sub> = –<i>l</i><sub><i>e</i></sub></sub><sup><i>l</i><sub><i>e</i></sub></sup>[summation]<sub><i>k</i><sub><i>e</i></sub></sub><sup><i>k</i><sub><i>e</i></sub><sup>max</sup></sup><i>H</i>(<i>O</i><sub>cutoff</sub> – <i>O</i><sub><i>l</i><sub><i>p</i></sub><i>m</i><sub><i>p</i></sub><i>l</i><sub><i>e</i></sub><i>m</i><sub><i>e</i></sub><i>k</i><sub><i>e</i></sub></sub>)<i>H</i>(|<i>c</i><sub><i>l</i><sub><i>p</i></sub><i>m</i><sub><i>p</i></sub><i>l</i><sub><i>e</i></sub><i>m</i><sub><i>e</i></sub><i>k</i><sub><i>e</i></sub></sub><sup><i>a</i><i>a</i><sup>[prime]</sup></sup>| – <i>c</i><sub>cutoff</sub><i>c</i><sub>00000</sub><sup><i>a</i><i>a</i><sup>[prime]</sup></sup>)<i>c</i><sub><i>l</i><sub><i>p</i></sub><i>m</i><sub><i>p</i></sub><i>l</i><sub><i>e</i></sub><i>m</i><sub><i>e</i></sub><i>k</i><sub><i>e</i></sub></sub><sup><i>a</i><i>a</i><sup>[prime]</sup></sup><i>g</i><sub><i>l</i><sub><i>p</i></sub><i>m</i><sub><i>p</i></sub><i>l</i><sub><i>e</i></sub><i>m</i><sub><i>e</i></sub><i>k</i><sub><i>e</i></sub></sub>(<i>theta</i>,<i>phi</i>,<i>Theta</i>,<i>Phi</i>,<i>Psi</i>),](024901_1_files/024901_1m42.gif)
where H is the Heaviside step function which takes a value of one for zero and positive values of the argument and is otherwise zero. Finally the estimate of the probability density faa(,,,,) is cut off at sufficiently low and high values in such a way that its logarithm takes a value within an appropriate range; for example, –7 –ln faa(,,,,) + ln(c
![<sub>00000</sub><sup><i>a</i><i>a</i><sup>[prime]</sup></sup>](024901_1_files/024901_1m43.gif) g00000)1.
g00000)1.
The orientational entropy defined by Eq. (17) is evaluated with the observed probability distribution of Eq. (24).
![<–ln <i>f</i><sub><i>a</i><i>a</i><sup>[prime]</sup></sub>(<i>theta</i>,<i>phi</i>,<i>Theta</i>,<i>Phi</i>,<i>Psi</i>)> [approximate] ((–1)/<i>N</i><sub><i>a</i><i>a</i><sup>[prime]</sup></sub>) [summation]<sub><i>µ</i> [is-an-element-of] {(<i>a</i><i>a</i><sup>[prime]</sup>)}</sub><i>w</i><sub><i>µ</i></sub> ln <i>f</i><sub><i>a</i><i>a</i><sup>[prime]</sup></sub>(<i>theta</i><sub><i>µ</i></sub>,<i>phi</i><sub><i>µ</i></sub>,<i>Theta</i><sub><i>µ</i></sub>,<i>Phi</i><sub><i>µ</i></sub>,<i>Psi</i><sub><i>µ</i></sub>).](024901_1_files/024901_1m44.gif)
D. Repulsive potentials
A repulsive potential used here is the one described in details in Ref. 3 to prevent packing at overly high densities; it consists of a hard core repulsion ehc, an excess contact energy e , and a repulsive packing potential e
 ,
,
![<i>E</i><sup><i>r</i></sup> = [summation]<sub><i>i</i></sub>{(1/2) [summation]<sub><i>j</i></sub><i>e</i><sup><i>h</i><i>c</i></sup>(<b>r</b><sub><i>i</i></sub>,<b>r</b><sub><i>j</i></sub>) + <i>e</i><sub><i>i</i><i>j</i></sub><sup><i>r</i><i>c</i></sup> + <i>e</i><sub><i>i</i></sub><sup><i>r</i><i>p</i></sup>},](024901_1_files/024901_1m47.gif)
![<i>e</i><sup><i>h</i><i>c</i></sup>(<b>r</b><sub><i>i</i></sub>,<b>r</b><sub><i>j</i></sub>) [equivalent] 10<i>S</i><sub><i>w</i></sub>(|<b>r</b><sub><i>i</i></sub> – <b>r</b><sub><i>j</i></sub>|,2.2,2.6),](024901_1_files/024901_1m48.gif)
![<i>e</i><sub><i>i</i><i>j</i></sub><sup><i>r</i><i>e</i></sup> = <i>H</i>(<i>n</i><sub><i>i</i></sub><sup><i>c</i></sup> – <i>q</i><sub><i>a</i><sub><i>i</i></sub></sub><sup><i>c</i></sup>)[((<i>q</i><sub><i>a</i><sub><i>i</i></sub></sub><sup><i>c</i></sup>/<i>n</i><sub><i>i</i></sub><sup><i>c</i></sup>) – 1)<i>e</i><sup><i>c</i></sup>(<b>r</b><sub><i>i</i></sub>,<b>r</b><sub><i>j</i></sub>)],](024901_1_files/024901_1m49.gif)
![<i>e</i><sub><i>i</i></sub><sup><i>r</i><i>p</i></sup> = <i>H</i>(<i>n</i><sub><i>i</i></sub><sup><i>c</i></sup> – <i>q</i><sub><i>a</i><sub><i>i</i></sub></sub><sup><i>c</i></sup>)[–ln(((<i>N</i>(<i>a</i><sub><i>i</i></sub>,<i>n</i><sub><i>i</i></sub><sup><i>c</i></sup>) + <i>epsilon</i>)/(<i>N</i>(<i>a</i><sub><i>i</i></sub>,<i>q</i><sub><i>a</i><sub><i>i</i></sub></sub><sup><i>c</i></sup>) + <i>epsilon</i>)))],](024901_1_files/024901_1m50.gif)
![<i>n</i><sub><i>i</i></sub><sup><i>c</i></sup> = [summation]<sub><i>j</i></sub> <i>Delta</i><sup><i>c</i></sup>(<b>r</b><sub><i>i</i></sub>,<b>r</b><sub><i>j</i></sub>),](024901_1_files/024901_1m51.gif)
where Sw is defined by Eq. (7). The repulsive packing potentials e for the 20 types of residues are estimated from the observed distributions of the numbers of contacting residues in dense regions of protein structures by assuming a Boltzmann distribution.3 N(ai,n ) is the observed number of residues of type ai that are surrounded by n residues in the database of protein structures. q
 is a coordination number, which is defined as the maximum feasible number of contacting residues around a residue, for the amino acid of type ai.
  in Eq. (40) is a small value (= 10–6) that is added to avoid the divergence of the logarithm function. The observed distribution N(ai,n) used here is one44 compiled from 2129 protein species representatives of the SCOP48 Release 1.53 with our sampling method.3
E. Short-range potentials
The short-range potential is evaluated here by the sum of dihedral angle dependent energies e (i,i) over all residues:
![<i>E</i><sup><i>s</i></sup> = [summation]<sub><i>i</i></sub><i>e</i><sub><i>a</i><sub><i>i</i></sub></sub><sup><i>s</i></sup>(<i>phi</i><sub><i>i</i></sub>,<i>psi</i><sub><i>i</i></sub>).](024901_1_files/024901_1m55.gif)
For this secondary structure potential, a 10° mesh over (,) space is used to count frequencies of amino acids observed in protein native structures, and this intraresidue potential e for each amino acid type a is evaluated as
![<i>e</i><sub><i>a</i></sub><sup><i>s</i></sup>(<i>phi</i>,<i>psi</i>) [equivalent] –ln(<i>N</i><sub><i>a</i></sub>(<i>phi</i>,<i>psi</i>)/<i>N</i><sub><i>a</i></sub>) + <ln(<i>N</i><sub><i>a</i></sub>(<i>phi</i>,<i>psi</i>)/<i>N</i><sub><i>a</i></sub>)>,](024901_1_files/024901_1m57.gif)
![<–ln(<i>N</i><sub><i>a</i></sub>(<i>phi</i>,<i>psi</i>)/<i>N</i><sub><i>a</i></sub>)> = ((–1)/<i>N</i><sub><i>a</i></sub>) [summation]<sub>(<i>phi</i>,<i>psi</i>)</sub><i>N</i><sub><i>a</i></sub>(<i>phi</i>,<i>psi</i>)ln(<i>N</i><sub><i>a</i></sub>(<i>phi</i>,<i>psi</i>)/<i>N</i><sub><i>a</i></sub>),](024901_1_files/024901_1m58.gif)
where Na(,) is the number of amino acids of type a at (,) observed in protein native structures, and Na is their sum over the entire (,) space, that is, the number of amino acids of type a. The second term is a constant term that corresponds to a reference energy, so that the (,) energy expected for each type of residue in the native structures is equal to zero.
The observed distribution Na(,) used here is one44 compiled from 2129 protein species representatives of the SCOP48 Release 1.53 with the sampling method3 used to reduce the weights of contributions of structures having high sequence identity.
F. Datasets of protein structures used
To estimate the orientational potential, proteins each of which represent a different protein fold were collected. Release 1.61 of the SCOP database48 was used for the classification of protein folds. Representatives of species are the first entries in the protein lists for each species in SCOP; if these first proteins in the lists are not appropriate (see below) to use, for the present purpose, then the second ones are chosen. These species are all those belonging to the protein classes 1–5; that is, classes of all , all , /, + , and multidomain proteins. Classes of membrane and cell surface proteins, small proteins, peptides, and designed proteins are not used. Proteins whose structures50 were determined by NMR or having stated resolutions worse than 2.5 Ĺ are removed to assure that the quality of proteins used is high. Also, proteins whose coordinate sets consist either of only C atoms, or include many unknown residues, or lack many atoms or residues, are removed. In addition, proteins shorter than 50 residues are also removed. As a result, the set of species representatives includes 4435 protein domains; this dataset is named here as dataset A.
The recognition power of the orientational potentials for the protein native structures is evaluated by using decoy sets, "Decoys'R'Us." 39 To avoid a bias, orientational potentials to be tested are compiled from a dataset of protein structures, in which native proteins included in the decoy sets are removed; the total number of proteins is reduced to 4369; this dataset is named dataset B.
Also, to remove sampling biases that result from sequence similarities among these representative proteins, a sampling weight for each protein is determined by the sampling method based on a sequence identity matrix between sequences, which is described in Ref. 3. In other words, each of the structures having similar sequences is sampled with a weight less than 1. As a result, the 4435 protein sequences of the dataset A correspond to the effective number, 3522, of sequences and include the effective number, 1 467 302, of residue-residue contacts. The 4369 sequences in the other protein dataset B corresponds to the effective number, 3506, of sequences and include the effective number, 1 463 806, of contacts. The orientational distributions of contacting residues are evaluated in the multimeric state of the complete protein structure for each protein domain.
III. RESULTS
A. Local coordinate system affixed to each residue
In order to describe the relative directional and rotational positions of contacting residues, a local coordinate system defined as in Fig. 1 is affixed to each residue. Here the local coordinate system is defined for fold recognition, based only on the main chain atoms of N, C, and C to represent the orientational relationship between the main chains of contacting residues rather than representing33,34,35 those relationships between the side chains. The origin O of the local coordinate system is located at the C position of each residue. The Y and Z axes are ones formed by the vector product and the sum of the unit vectors from N to C and from C to C, respectively. That is, the Y and Z axes are taken to be perpendicular to and in the plane of the three atoms N, C, and C, respectively. These form a right-handed coordinate system. There are two degrees of directional freedom and three degrees of rotational freedom in the relative orientation of one residue to another in contacting residue pairs. The relative direction and rotation of one residue to another in contacting residues are represented by polar angles (,) and Euler angles (,,), respectively.
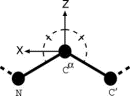 Figure 1.
 B. Orientational distributions of contacting residues
Release 1.61 of the SCOP database48 for classification of protein folds has been used to choose representatives for different protein folds. In the 4435 chosen representative proteins, which correspond to the 3522 effective number of sequences, the 1 467 302 effective number of residue-residue contacts are observed and used here to evaluate the statistical distribution of relative residue-residue orientations for each type of residue pair. The orientational distributions are evaluated in the multimeric state of a whole protein structure for each protein domain.
As described in the Methods section, the sample size limits the frequencies of modes whose expansion coefficients can be reliably estimated. Here, values in the range 4–14 are used for l , l
, l , and k that are the maximum values of lp, le, and ke which are the highest frequency modes to be estimated. However, even though each of (lp, mp, le, me, ke) is sufficiently small, their combinations may correspond to high frequency modes. The number of modes lower than or equal to (lp, mp, le, me, ke), Olpmplemeke defined by Eq. (32), is used as a one-dimensional projection of (lp, mp, le, me, ke) on a frequency axis. To remove high frequency modes, only frequency modes less than and equal to Ocutoff are utilized. In addition, only significant terms in the expansion of Eq. (35) whose coefficients take larger absolute values than the value of a cutoff, ccutoffc, are used to estimate the distributions of relative residue-residue orientations.
Deviations from the uniform distribution in the estimated orientational distributions can be measured by reductions in orientational entropy. In the case of the uniform distribution, the orientational entropy defined by Eq. (17) is equal to –ln(cg00000) = 6.900 in kB units; kB is the Boltzmann constant. The estimate of orientational entropy for each type of residue pair and the number of significant terms required for the estimation depends on the resolution of the potentials, that is, the values of l, l, and k, and also the cutoff parameters of Ocutoff and ccutoff, and for the correction for a small sample size. Orientational entropies estimated with various values of the parameters are shown in Fig. 2, and the numbers of significant terms required are plotted in Fig. 3. Orientational entropies and the numbers of significant terms averaged with a weight of the number of contacts over all residue pairs are plotted against the cutoff value of the coefficient for expansion terms, ccutoff. Triples of digits near curves in the figure indicate the values of (l, l, and k). The entropy reduction is large when the resolution of the potential increases. The estimate of orientational entropy with l = l = k = 4,5,6 almost converges at the cutoff value, ccutoff = 0.025. The number of significant terms decreases almost exponentially with the cutoff value, ccutoff; see Fig. 3. The number of significant terms required for each type of residue pair is related to the orientational entropy for the residue pair. Figure 4 shows the correlation between the orientational entropies and the number of significant terms. As expected, many significant terms tend to be required for residue pairs whose orientational entropies are large. The frequency distribution of the number of significant terms for the 210 types of residue pairs is shown in Fig. 5, indicating that the orientational distribution strongly depends on the type of residue pair.
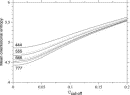 Figure 2.
 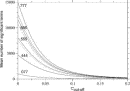 Figure 3.
 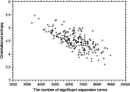 Figure 4.
 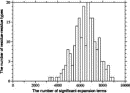 Figure 5.
 The orientational entropies  –ln faa
 for each type of residue pair are listed in Table I. Residue type "r" in Table I means any type of residue. As already noted in the Methods section, in principle this matrix is symmetrical. The table shows that the matrix is almost symmetrical, indicating the good quality of their statistical estimates. These values in this table are calculated with l = l = k = 6, Ocutoff = O33333 = 1792, = 0.2, and ccutoff = 0.025.
Orientational entropies for residue pairs with GLY appear to be relatively large. Also orientational entropies for residue pairs with PRO tend to be larger than those for others but smaller than those for residue pairs with GLY. Residue pairs TRP-CYS/CYS-TRP have the smallest orientational entropies. Orientational entropies for residue pairs with CYS and GLU are relatively small. As expected, CYS-CYS, GLU-GLU, GLU-ASP/ASP-GLU, and LYS-LYS have relatively small orientational entropies, probably because of S–S bond interactions and charge-charge interactions.
C. Distributions of residue orientations depend significantly on Euler angles
It is interesting to see how much the entropy reductions originate either from polar angle dependences or Euler angle dependences only, and from cross correlations between them; the orientational entropy is defined by Eq. (17) and estimated by Eq. (36).
In Fig. 6, the broken line shows the maximum value of orientational entropy which each type of amino acid pair can take; it is equal to –ln(cg00000) = 6.900 for the uniform distribution. The abscissa indicates the amino acid pair identification number; amino acid types are numbered in the order of amino acids written along the abscissa. Thus, the amino acid pair identification number one means a CYS-CYS pair and 400 means a PRO-PRO pair. The lowest solid line is for a distribution estimated with l = l = k = 6. The highest solid line shows the orientational entropies estimated with l = 6, l = k = 0, and therefore the contribution to the total entropies from polar angle dependences. The middle line shows the orientational entropies estimated by subtracting the entropy, 6.900, for the uniform distribution from the sum of entropies estimated with l = 6, l = k = 0, and with l = 0, l = k = 6. In other words, the difference between the highest solid line and the middle line shows contributions to the total entropies from Euler angle dependences. The difference between the middle and lowest solid lines corresponds to contributions from the cross correlation between polar angle and Euler angle dependences. Cutoff values for significant terms in the expansion are Ocutoff = 1792 and ccutoff = 0.025. The parameter for the correction for a small sample size is = 0.2.
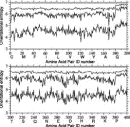 Figure 6.
 These results clearly indicate that only small amounts of entropy reduction originate purely from polar angle dependences, and that the distribution of residue orientations has significantly large correlations between polar and Euler angles. Also, the fact that the lowest solid line is more jagged than the upper lines indicates that the distributions as a function of polar and Euler angles, can reflect more differences among the types of residue pairs than the others. Thus, the discriminations of native structures from non-native folds is expected to be improved by taking account of Euler angle dependencies in the distributions of residue-residue orientations.
D. Recognition power for native structures
We have evaluated the recognition power of the orientational potentials for native structures using independently constructed decoy sets, which are maintained at "http://dd.stanford.edu" as the database "Decoys'R'Us." 39 Here, the group of decoy sets named "multiple" are employed. This group of decoy sets consists of the following ten families of decoy sets classified by methods used to generate decoys. Each decoy set provides multiple non-native structures as well as the native structure.
(1) The "4state_reduced" family containing decoy sets for seven small proteins. C positions for these decoys were generated by exhaustively enumerating ten selectively chosen residues in each protein using a four-state off-lattice model.36
(2) The "fisa" family containing decoy sets for four helical proteins. The main chains for these decoys were generated using a fragment insertion simulated annealing procedure to assemble nativelike structures from fragments of unrelated protein structures with similar local sequences using Bayesian scoring functions.37
(3) The "fisa_casp3" containing decoy sets for proteins predicted by the Baker group for CASP3. The same method as for the fisa set was used to generate the main chains and side chains for these decoys.
(4) The "hg_structal" family containing decoy sets for 29 globins. Each decoy has been built by comparative modeling using 29 other globins as templates with the program "segmod." 51
(5) The "lattice_ssfit" family containing decoy sets for eight small proteins generated by ab initio methods.38
(6) The local minima decoy set family ("lmds") which containing decoy sets derived from the experimental secondary structures of ten small proteins belonging to diverse structural classes. Each decoy is at a local minimum of an energy function.
(7) The second version, "lmds_v2," of the local minima decoy set family, lmds.
(8) The "semfold" family containing decoy sets for six proteins.
(9) The "ig_structal" family containing decoy sets for 61 immunoglobulin domains. Each decoy has been built by comparative modeling using all the other immunoglobulins as templates with the program segmod.51
(10) The "ig_structal_hires" family that is a high resolution subset of ig_structal, and contains decoy sets for 20 immunoglobulins. The resolution range is for this set is 1.7–2.2 Ĺ compared to the range of 1.7–3.1 Ĺ for the full 61 set.
In the following, these families of decoy sets are categorized into two classes one of which consists of only the last two families above, i.e., the decoy set group of immunoglobulin domains that are single chains of a multimer, and the other which contains the rest of the decoy families above and is called the decoy set group of monomeric proteins; although hg_structal contains decoy sets for some hemoglobins which are tetrameric proteins, and the fragment B of protein A, which is in a complex with immunoglobulin Fc, is also contained as the decoy set 1FC2 in the decoy set families fisa, lmds, and lmds_v2. This classification that depends on whether decoys are a single chain of a multimer is based on the fact that the true ground state of those multimeric proteins requires all of the chains to be present; it is true especially for contact energies, although it is not expected for the orientational energies developed here or short-range potentials such as the secondary structure potentials. The decoy set group of monomeric proteins consists of 79 decoy sets, and the decoy set group of immunoglobulin domains consists of 81 decoy sets.
In the evaluation of the recognition performance of potential functions for the native structures, proteins contained in the decoy sets have been removed from a dataset of proteins from which the orientational potentials are compiled; that is, the dataset B is used.
E. Evaluation of the performance of potential functions in fold recognition
The performance of potential functions in fold recognition is evaluated for each decoy set by the rank, the logarithm of rank probability, and the Z score of the native fold in the energy scale, and by those of the lowest energy fold in the root mean square deviation (RMSD) scale. RMSD means the least root mean square deviation between C atoms in overlaps between the native structure and decoys. The rank probabilities, Pe in the energy scale and Pr in the RMSD scale, are defined as
![<i>P</i><sub><i>e</i></sub> [equivalent] the rank of the native fold in an energyscale/the number of decoys,](024901_1_files/024901_1m61.gif)
![<i>P</i><sub><i>r</i></sub> [equivalent] the rank of the lowest energy fold in theRMSD scale/the number of decoys,](024901_1_files/024901_1m62.gif)
The Z scores Ze in the energy scale and Zrmsd in the RMSD scale are defined as
![<i>Z</i><sub><i>e</i></sub> [equivalent] ((<i>E</i><sub>native</sub> – overline(<i>E</i><sub>decoy</sub>))/(<i>sigma</i><sub><i>E</i></sub>)),](024901_1_files/024901_1m63.gif)
![<i>Z</i><sub><i>r</i></sub> [equivalent] <i>Z</i><sub>rmsd</sub> [equivalent] ((RMSD<sub>lowest</sub> – overline(RMSD<sub>decoy</sub>))/(<i>sigma</i><sub>rmsd</sub>)),](024901_1_files/024901_1m64.gif)
where  and
and  E are the mean and the standard deviation of energies of decoys, and
  and rmsd are the mean and the standard deviation of RMSD of decoys. RMSDlowest is the RMSD of the lowest energy fold.
The correlation coefficient R of rank order between the energies and RMSDs of decoys is also listed in some tables, because it was used in Ref. 25.
F. How important are the Euler angle dependencies of relative residue orientations for fold recognition?
First, we examine how the discrimination power is improved by taking account of the Euler angle dependencies of relative orientations between residues. In the case of l = k = 0, Euler angle dependencies are completely ignored. Thus, the comparisons of the performances of discrimination between the cases of l = k = 0 and l,k![[not-equal]](024901_1_files/ne.gif) 0 indicate how important the Euler angle dependencies of relative residue orientations are in fold recognition. In Tables II and III, the performances of discrimination are compared among some combinations of parameters l and l for both the decoy set groups of monomeric proteins and immunoglobulin domains; k was taken to be equal to l. The full lists of these tables are provided in the auxiliary material.52 Here, the potentials consist of the orientational potential eo only. In these tables, the performances of discrimination are evaluated by the number of decoy sets (no. of tops) in which the native structure is the lowest energy fold, and also the averages over the decoy sets of the logarithms of rank probabilities Pe in the energy scale and Pr in the RMSD scale, and the mean Z scores Ze of the native folds in the energy scale.
0 indicate how important the Euler angle dependencies of relative residue orientations are in fold recognition. In Tables II and III, the performances of discrimination are compared among some combinations of parameters l and l for both the decoy set groups of monomeric proteins and immunoglobulin domains; k was taken to be equal to l. The full lists of these tables are provided in the auxiliary material.52 Here, the potentials consist of the orientational potential eo only. In these tables, the performances of discrimination are evaluated by the number of decoy sets (no. of tops) in which the native structure is the lowest energy fold, and also the averages over the decoy sets of the logarithms of rank probabilities Pe in the energy scale and Pr in the RMSD scale, and the mean Z scores Ze of the native folds in the energy scale.
Table II(a) shows the dependencies of the recognition power on the resolution in polar angles; note that Euler angle dependencies are completely ignored with l = k = 0. Both the monomeric protein decoy set group and immunoglobulin decoy set group show similar characteristics; when the resolution, that is, the value of l increases up to 7, the number of top ranks tends to increase and the means of the log rank probabilities,  in the energy scale and
  in the RMSD scale, tend to be improved with more negative values. The potentials with 7<l<14 appear to yield worse results than that of l = 7. At l = 14, the orientational potential shows a similar performance to that for l = 7. These results indicate that the improvement in the performance of fold recognition is not monotonic with the number of expansion terms, and also that there may be an intrinsic periodicity in the polar-angle distribution of residue-residue orientations.
Similar performance is obtained for both the decoy set group by using the Euler angle distributions of residue-residue orientations. The dependencies of the recognition power on the resolution in Euler angles are shown in Table II(b). For this table, l = 0 is used, so that polar-angle dependencies are completely ignored. The best result in the cases of 4l = k7 is obtained in the case of the highest resolution, l = 0,l = k = 7. In comparison with the results of l = 7,l = k = 0, some improvement is clearly observed for the immunoglobulin decoy set group, although the performance of z score Ze is slightly worse for the monomeric protein decoy set group. The native structures of immunoglobulin domains consist mainly of sheets. Hydrogen bonds between strands are essential to maintain sheets. In addition to hydrogen bonds, residue-residue packing between a sheet and other parts may require relatively stringent orientations between residues, especially for Euler angles.
To improve the performance, correlations between polar and Euler angle dependencies must be taken into account. Table III shows the improvements in recognition performance obtained by taking account of the correlations between polar and Euler angle dependencies. Table III(a) indicates that the recognition performance is improved about 10% to 30% for both of the decoy set groups with increase of resolution, but has a limitation around l = l = k~6,Ocutoff~1792, probably owing to the sample size. However, the comparison of the results for l = 7,l = k = 0, l = l = k = 7, Ocutoff = O77000 = 64, and l = l = k = 7, Ocutoff = O00777 = 960 indicates that including small numbers of lower orders of cross terms between polar and Euler angles does not lead to an improvement in performance and sufficient numbers of cross terms are required to improve the performance. This may be one of reasons why Onizuka et al.33 observed worse rather than better performances by taking account of Euler angle dependencies in orientational distributions.
Dependencies of the performance on the cutoff parameters are also examined. In cases of low resolution in which only polar dependencies are taken into account, the effects of the cutoff parameter ccutoff on the recognition performance are not clear for the cases of ccutoff = 0,0.025,0.5. However, in the cases of high resolution the value 0.05 for ccutoff is not small enough to reproduce the orientational distributions for fold recognition. See tables in the auxiliary material52 for details. The threshold ccutoff for significant expansion terms should be set as small as ccutoff~0.025. This is consistent with the fact that as shown in Fig. 2 the mean orientational entropies can be reproduced by employing ccutoff~0.025. Using a value for ccutoff lower than 0.025 does not always yield good performance and may even decrease the recognition power, probably because the expansion terms with small values of coefficients tend to correspond to statistical noise. Thus, the value of 0.025 is used here for ccutoff.
The effects of for a small sample correction are shown in Table III(c). The potential shows a better performance around = 0.2; Naa/18 000(= 1 467 302/400/0.2). This means that the first digit will be significant in the estimated values of the expansion coefficients for the terms of Olpmplemeke = 1792, because in Eq. (31) becomes about 0.1 for Olpmplemeke = 1792. Thus, the values of = 0.2 and Ocutoff = 1792 would be consistent with one another.
The parameters of l = l = k = 6 with Ocutoff = 1792, ccutoff = 0.025, and = 0.2 are employed here, although Ocutoff = 960 is also good, and could be chosen if one wants to reduce the number of expansion terms. The discrimination of the native structures is successful for 37 of the 79 monomeric decoy sets and for 59 of the 81 immunoglobulin decoy sets using the orientational energy.
The value of ln Pe for each decoy set is shown in Fig. 7; (a) for the decoy sets of monomeric proteins, and (b) for the immunoglobulin decoy sets. The abscissa shows the identification number of the decoy set that is listed for each decoy in tables in the auxiliary material.52 Cross marks and solid lines indicate the values for the case of l = 7,l = k = 0; both are the best case for each decoy set group if only polar-angle dependencies are taken into account. Open circles and broken lines are for the case of l = l = k = 6. For most decoy sets, the performance in the discrimination of the native structures is improved.
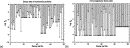 Figure 7.
 G. How important are relative orientations between residues in fold recognition?
A summary of the effects for each potential component in Eq. (1) on the performance in fold recognition is listed in Table IV. The energy terms included in the total energy potential are listed in the first column of the table. The performances of those total energy potentials are evaluated by the number of top ranks (no. of tops), the means over all decoy sets of the logarithms of rank probabilities ln Pe in the energy scale and ln Pr in the RMSD scale, and of the Z scores Ze in the energy scale and Zrmsd in the RMSD scale, and the medians of those Z scores in all decoy sets. Also the mean values  over all decoy sets of the correlation coefficients of rank order between the energies and RMSDs of the decoys are listed for reference.
First, the results for the monomeric protein decoy set group clearly show the orientational potential eo can achieve a performance comparable to the simple contact potentials, without and with the collapse energy, ec and e + ec, indicating that residues in the non-native structures are not well positioned with respect to the relative orientation between them.
It should be noted here that for the monomeric decoy set group the performance of the contact potential ec without the orientational energy is slightly better than that of the orientational energy eo only, but it is significantly worse for the immunoglobulin decoy set group. Including the collapse energy e causes the performance to become even worse, indicating that the contact potential without the orientational potential does not work at all for these decoy sets. In the case of multimeric proteins, the evaluation of contact energies for residues on the surface of the domain requires other domains and chains to be present. When other domains and chains are not available for a given domain, residue-residue contacts between domains and chains cannot be evaluated. Thus, as already mentioned, unlike short-range potentials, the true ground state of those multimeric proteins in the contact potential requires all of the chains to be present. Especially in the case of immunoglobulin molecules, the interface among constant and variable domains occupies a large portion of the surface of the domains. Thus, the potential consisting of the simple contact energy shows an extremely poor performance for the immunoglobulin decoy sets. On the other hand, the orientational potential only measures how good or bad the relative orientations between contacting residues are, and thus its evaluation does not necessarily require the presence of all domains and chains in multimeric proteins, although it would be more precisely measured if all contacting residues were known; as seen from Eq. (11), the expected value of the orientational energy for contacting residues in native protein structures is adjusted to be equal to zero.
It is noteworthy that in Table IV(a) a large improvement in performance is not seen for the monomeric protein decoy set group, in which decoys have relatively compact structures, by adding the residue-type independent contact energy e to the residue-type dependent contact potential ec except for the case of the energy ec + eo. This fact indicates that optimizing potentials is not simple.
It is interesting to note that the inclusion of the repulsive potential er partially improves the performance for the immunoglobulin decoy set group, in comparison with the case for the monomeric decoy set group. The repulsive potential favors packing densities similar to the residue densities observed in native structures. Thus, the fact that the repulsive potential works well for these decoy sets may indicate that these decoys do not mimic well the native structures with respect to residue density. However, for well designed decoys, the packing potential may work less favorably for the native fold as shown in the case of the monomeric decoy set family.
The performance of the potential function is further improved for both of the present decoy sets by including the simple short-range (,) potential, strongly indicating that the short-range interactions should not be ignored in fold recognition.
The improvement of the performance for fold recognition due to the orientational potential is also observed for almost all decoy sets. In Fig. 8, the value of the logarithms of rank probabilities in the energy scale ln Pe for each decoy set is plotted against the identification number of the decoy set that is listed for each decoy in Table V and tables in the auxiliary material;52 (a) is for the monomeric protein decoy set group and (b) for the immunoglobulin decoy set group. Open circles and broken lines show the values for the potential function that includes the orientational energy eo, and cross marks and solid lines are for the potential without the orientational energy. Even in the decoy sets of the monomeric proteins, ln Pe for each decoy set tends to be more negative in the potential that includes the orientational energy.
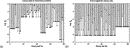 Figure 8.
 H. Comparison of the performance of the present potential function with other potentials
The performance of the present potential function for each decoy family is listed in Table V, and that for each decoy set is provided as tables in the auxiliary material.52
Table V and the tables in the auxiliary material52 also show the performances of some of the scoring functions24,25,33,34,35 that have already been tested for some of these decoys. Those scoring functions referred to here are four statistical potentials and one atomic semiempirical potential. These four statistical potentials are the atomic contact potential developed by Samudrala and Moult,13 the distance-dependent pair potential optimized for fold recognition by Toby and Elber,24 the optimal Chebyshev-expanded function -minimizing Z scores devised by Fain, Xia, and Levitt,25 and the distant-dependent angular potential named "3C326" developed by Onizuka et al.33 The atomic semiempirical potential referred to here is a potential based on the CHARMM gas phase implicit hydrogen force field in conjunction with a generalized Born implicit solvation term by Dominy and Brooks,18 which includes specifically a generalized Born, Coulomb, nonpolar solvation and van der Waals energy terms. Data for the potential of Samudrala and Moult13 are taken from Fain, Xia, and Levittet.25
The decoy sets of protein 1FC2 are found in the three decoy set families of fisa, lmds, and lmds_v2, and in all of these decoy sets the present potential failed to identify the native folds. The coordinates of the native fold 1FC2 is for the fragment B of protein A in a complex with immunoglobulin Fc. All chains that interact with the fragment B may be required to estimate the ground state energy for this structure, especially because this fragment is only 43 residues long. The decoy sets of protein 1BBA are also found in two decoy set families, lmds and lmds_v2. This protein is pancreatic hormone that consists of only 36 residues, and is expected to interact with relatively large receptor proteins. Protein 1NKL in lattice_ssfit and semfold can bind lipid, and protein 1BGA8-A in fisa_casp3 is found in the trimeric state in the PDB coordinate file. Thus, one reason why the present potential fails for some decoy sets may be that some chains are missing for the proper estimation of the ground state for these decoy sets. Otherwise, there could be interactions that are not taken into account in the present potential function.
However, overall the present potential function performs well in comparison with other scoring functions. The discrimination for the native structure is successful for 61 of 79 monomeric decoy sets and for 68 of 81 immunoglobulin decoy sets. Also, the mean Z score Ze in the energy scale which is equal to –4.45 for monomeric decoy sets and –3.29 for immunoglobulin decoy sets is statistically significant. For the decoy sets in the globin family hg_structal, interactions between a heme and surrounding residues are not taken into account. Although the present potential fails to identify the native fold for 7 of 29 decoy sets in this family, the RMSD of the lowest energy fold is below 1 Ĺ in 4 of these 7 decoy sets.
Table V clearly shows that the present method outperforms the other potentials for all the decoy families except for the fisa and fisa_casp3 decoy families for which the potential developed by Toby and Elber is better in the mean value of energy Z score, although the present potential performs better than their potential in the cases of 4state_reduced, lattice_ssfit, and lmds decoy families. One of interesting facts is that the atomic semiempirical potential based on the CHARMM potential with a generalized Born, Coulomb, nonpolar solvation and van der Waals energy terms cannot perform better than the present coarse-grained potential, at least for the reported two decoy families 4state_reduced and hg_structal. At the current development stage of atomic potentials, identifying native structures appears to be a hard task, and atomic potentials without explicitly taking account of solvent molecules cannot necessarily perform better than coarse-grained and residue-level statistical potentials. On the other hand, explicitly taking account of water molecules would take too much CPU time to estimate conformational free energies. This fact motivates our studies to develop coarse-grained potentials.
The correlation coefficient R of rank order between the energies and RMSDs of decoys is listed in Table V and tables in the auxiliary material.52 because it was used also in Ref. 25. There are many decoy sets for which the potential succeeds in identifying the native fold and for which both values of Z scores, Ze and Zr, are large but the correlation coefficient R of rank order has values smaller than 0.3; see those values for the decoy set families of lattice_ssfit, lmds, lmds_v2, and semfold. Thus, generally speaking, this measure R may be inappropriate for the evaluation of the performance of scoring functions. It may be appropriate only for some decoy sets, which consist of near-native decoys only, such as the decoy sets in 4state_reduced.
IV. DISCUSSION
The present analyses of relative residue-residue orientations clearly indicate that the distribution of residue-residue orientations strongly depends on the Euler angles that specify three degrees of rotational freedom for one residue relative to another, and it is possible to improve the performance of an energy potential in fold recognition by taking account of the Euler angle dependencies in residue-residue orientations.
In the analyses of relative residue-residue orientations by Buchete et al.,34,35 the Euler angle dependencies of residue-residue orientations were not completely taken into account, probably because the number of residue-residue pairs observed in known protein structures is relatively small to reliably estimate the orientational distribution with the required resolution by dividing space into many cells and counting samples observed in each cell. In order to overcome such problems, we chose a method proposed by Onizuka et al.33 in which the observed distribution of residue-residue orientations is represented as a sum of functions each of which represents the observed location in angular space. Then, the distribution of residue-residue orientations is estimated in the expansion with spherical harmonics functions and the coefficients of the expansion terms are estimated by inversely transforming the observed distribution represented as the sum of functions.
High frequency modes in the expansion must be ignored because they reflect artificial contributions originating in the small size of samples. Each term in the expansion has a different resolution with various combinations of frequencies for each coordinate axis. A trivial example is that the first term g00000 corresponding to a uniform distribution has the lowest resolution. Here, resolution of each term is represented by Olpmplemeke, that is, defined as the number of frequency modes lower than or equal to (lp, mp, le, me, ke) by Eq. 32 and only terms whose Olpmplemeke is less than a cutoff value Ocutoff are used. The merit of this method is that the distribution can be constructed by using only expansion terms whose resolutions are low enough to be able to be estimated from a limited number of samples of known protein structures. On the other hand, the cell partitioning method has a fixed resolution for each coordinate axis, so that high frequency modes with large values of Olpmplemeke can be included in the estimation of orientational distributions.
Because the resolution of each term is different from others, each term is differently corrected for the small size of samples according to its resolution; see Eqs. (27,28,29,30,31,32) In this correction scheme, the number of residue-residue pairs required for the estimation of an expansion coefficient clpmplemeke increases proportionally with its resolution Olpmplemeke. The proportionality constant was determined on the basis of the performance of the potentials in fold recognition. Also, the maximum resolution that can be estimated depends on the sample size. The maximum values for lp, mp, le, me, and ke, and for Olpmplemeke are determined on the basis of the performance of the potentials in fold recognition.
Also, the reference distribution of residue-residue orientations for the present orientational potentials is not the overall distribution for all types of amino acid pairs but the uniform distribution, differing from other works.33,34,35 It depends on decoy sets whether the uniform distribution for a reference distribution is effective. If the structures of decoys have a similar overall distribution to that of native structures, then it will not be effective. However, such an overall distribution of residue-residue orientations would not be intrinsically characteristic of non-native conformations but instead of native structures of proteins. If so, this overall distribution may be one of the important characteristics to distinguish protein-like structures from others. On the other hand, there is no reason to avoid employing the uniform distribution for a reference distribution. The use of the uniform distribution as a reference distribution is desirable to fully evaluate the orientational distribution of each type of contacting residue pair in decoy structures. Our scheme differs from previous works33,34,35 and allows us to more properly evaluate the effectiveness of the orientational potential on fold recognition.
However, the present method of evaluating orientational energies between contacting residues requires the evaluation of a large number of expansion terms.53 Although this feature is a trade-off accompanied with the simplification of representing residues by single points, it can be an obstacle to using this method in CPU intensive calculations in which energy evaluations of many conformations are required. To reduce CPU time in the evaluation of orientational energies, orientational energies could be precalculated at grid points in the polar and Euler angular space, although this approach requires a large memory and disk space as a trade-off against CPU time.
In the present work, the total energy in Eq. (1) is assumed to consist of a simple sum of energy terms, because each energy potential has been evaluated in a similar manner as the potential of mean force from statistical distributions of residues observed in protein structures, avoiding overcounting particular interactions. One might assume a different weight for each contribution to the total energy, and try to optimize a weight for each energy term by minimizing the Z score Ze for the decoy sets.16 However, equal weights are employed here for each term, because a set of optimum weights could strongly depend on the training decoy sets. For example, if bad contacts are removed and torsion angles are optimized for decoy structures, then the packing potential and the secondary structure potential tend to be useless in discriminating the native structures from decoys, and optimum weights for those potentials determined by minimizing the Z score would take on relatively small values. The training decoys for optimizing a weight of each energy term in a total potential must be carefully generated without bias. In addition, generating unfolded decoys is also necessary to obtain an appropriate value with such an optimizion method for the collapse energy, which is represented as e and which is an extremely important energy for a protein to fold that compensates for the large conformational entropy loss of compact conformations.
REFERENCES
Citation links [e.g., Phys. Rev. D 40, 2172 (1989)] go to online journal abstracts. Other links (see Reference Information) are available with your current login. Navigation of links may be more efficient using a second browser window.
Auxiliary Material (EPAPS)
-
S. Tanaka and H. A. Scheraga, Macromolecules 9, 945 (1976). [MEDLINE] [ChemPort]
first citation in article
-
S. Miyazawa and R. L. Jernigan, Macromolecules 18, 534 (1985). [ISI] [ChemPort]
first citation in article
-
S. Miyazawa and R. L. Jernigan, J. Mol. Biol. 256, 623 (1996). [ISI] [MEDLINE] [ChemPort]
first citation in article
-
S. Miyazawa and R. L. Jernigan, Proteins 34, 49 (1999). [ISI] [MEDLINE] [ChemPort]
first citation in article
-
S. Miyazawa and R. L. Jernigan, Proteins 36, 347 (1999). [ISI]
first citation in article
-
S. Miyazawa and R. L. Jernigan, Proteins 36, 357 (1999). [ISI] [MEDLINE] [ChemPort]
first citation in article
-
S. Miyazawa and R. L. Jernigan, Protein Eng. 13, 459 (2000). [MEDLINE] [ChemPort]
first citation in article
-
M. J. Sippl, J. Mol. Biol. 213, 859 (1990). [ISI] [MEDLINE] [ChemPort]
first citation in article
-
A. Godzik, A. Koli
 ski, and J. Skolnick, Protein Sci. 4, 2107 (1995). [ISI] [MEDLINE] [ChemPort]
first citation in article
ski, and J. Skolnick, Protein Sci. 4, 2107 (1995). [ISI] [MEDLINE] [ChemPort]
first citation in article
-
C. Zhang and S. H. Kim, Proc. Natl. Acad. Sci. U.S.A. 97, 2550 (2000). [MEDLINE] [ChemPort]
first citation in article
-
F. Melo and E. Feytmans, J. Mol. Biol. 267, 207 (1997). [ISI] [MEDLINE] [ChemPort]
first citation in article
-
C. Zhang, G. Vasmatzis, J. L. Cornette, and C. DeLisi, J. Mol. Biol. 267, 707 (1997). [MEDLINE] [ChemPort]
first citation in article
-
R. Samudrala and J. Moult, J. Mol. Biol. 275, 895 (1998). [ISI] [MEDLINE] [ChemPort]
first citation in article
-
P. Mallick, R. Weiss, and D. Eisenberg, Proc. Natl. Acad. Sci. U.S.A. 99, 16041 (2002). [MEDLINE] [ChemPort]
first citation in article
-
A. Liwo, S. O
 dziej, M. R. Pincus, R. J. Wawak, S. Rackovsky, and H. A. Scheraga, J. Comput. Chem. 18, 849 (1997). [ISI] [ChemPort]
first citation in article
dziej, M. R. Pincus, R. J. Wawak, S. Rackovsky, and H. A. Scheraga, J. Comput. Chem. 18, 849 (1997). [ISI] [ChemPort]
first citation in article
-
A. Liwo, M. R. Pincus, R. J. Wawak, S. Rackovsky, S. Odziej, and H. A. Scheraga, J. Comput. Chem. 18, 874 (1997). [Inspec] [ISI] [ChemPort]
first citation in article
-
A. Liwo, R. Ka
 mierkiewicz, C. Czaplewski et al., J. Comput. Chem. 19, 259 (1998). [ISI] [ChemPort]
first citation in article
mierkiewicz, C. Czaplewski et al., J. Comput. Chem. 19, 259 (1998). [ISI] [ChemPort]
first citation in article
-
B. N. Dominy and C. L. Brook III, J. Comput. Chem. 23, 147 (2002). [Inspec] [ISI] [MEDLINE] [ChemPort]
first citation in article
-
G. M. Crippen, Biochemistry 30, 4232 (1991). [ISI] [MEDLINE] [ChemPort]
first citation in article
-
V. N. Maiorov and G. M. Crippen, J. Mol. Biol. 227, 876 (1992). [ISI] [MEDLINE] [ChemPort]
first citation in article
-
L. A. Mirny and E. I. Shakhnovich, J. Mol. Biol. 264, 1164 (1996). [ISI] [MEDLINE] [ChemPort]
first citation in article
-
M. Vendruscolo, L. A. Mirny, E. I. Shakhnovich, and E. Domany, Proteins 41, 192 (2000). [MEDLINE] [ChemPort]
first citation in article
-
D. Toby, G. Shafran, N. Linial, and R. Elber, Proteins 40, 71 (2000). [ISI] [MEDLINE] [ChemPort]
first citation in article
-
D. Toby and R. Elber, Proteins 41, 40 (2000). [ISI] [MEDLINE] [ChemPort]
first citation in article
-
B. Fain, Y. Xia, and M. Levitt, Protein Sci. 11, 2010 (2002). [MEDLINE]
first citation in article
-
K. T. Simons, C. Ruczinski, C. Kooperberg, B. Fox, C. Bystroff, and D. Baker, Proteins 34, 82 (1999). [MEDLINE] [ChemPort]
first citation in article
-
A. R. Panchenko, A. Marchler-Bauer, and S. H. Bryant, J. Mol. Biol. 296, 1319 (2000). [MEDLINE] [ChemPort]
first citation in article
-
A. Koliski, A. Godzik, and J. Skolnick, J. Chem. Phys. 98, 7420 (1993). [ISI] [ChemPort]
first citation in article
-
A. Koliski, A. Godzik, and J. Skolnick, Proteins 26, 271 (1996). [ISI] [MEDLINE] [ChemPort]
first citation in article
-
P. J. Munson and R. K. Singh, Protein Sci. 6, 1467 (1997). [ISI] [MEDLINE]
first citation in article
-
C. W. Carter, Jr., B. C. LeFebvre, S. A. LCammer, A. Tropsha, and M. H. Edgell, J. Mol. Biol. 311, 625 (2001).
first citation in article
-
A. Liwo, C. Czaplewski, J. Pillardy, and H. A. Scheraga, J. Chem. Phys. 115, 2323 (2001). [ISI] [ChemPort]
first citation in article
-
K. Onizuka, T. Noguchi, Y. Akiyama, and H. Matsuda, Control Intell. Syst. 17, 48 (2002).
first citation in article
-
N.-V. Buchete, J. E. Straub, and D. Thirumalai, J. Chem. Phys. 118, 7658 (2003). [ISI]
first citation in article
-
N.-V. Buchete, J. E. Straub, and D. Thirumalai, Protein Sci. 13, 862 (2004). [MEDLINE] [ChemPort]
first citation in article
-
B. Park and M. Levitt, J. Mol. Biol. 258, 367 (1996). [ISI] [MEDLINE] [ChemPort]
first citation in article
-
K. T. Simons, C. Kooperberg, E. S. Huang, and D. Baker, J. Mol. Biol. 268, 209 (1997). [ISI] [MEDLINE] [ChemPort]
first citation in article
-
R. Samudrala, Y. Xia, M. Levitt, and E. S. Huang, Proceedings of the Pacific Symposium on Biocomputing 1999.
first citation in article
-
R. Samudrala and M. Levitt, Protein Sci. 9, 1399 (2000). [MEDLINE]
first citation in article
-
D. G. Covell and R. L. Jernigan, Biochemistry 29, 3287 (1990). [ISI] [MEDLINE] [ChemPort]
first citation in article
-
J. Lee, A. Liwo, D. R. Ripoll, J. Pillardy, J. A. Saunders, K. D. Gibson, and H. A. Scheraga, Int. J. Quantum Chem. 77, 90 (2000). [Inspec] [ISI]
first citation in article
-
Y. Zhang, A. Koliski, and J. Skolnick, Biophys. J. 85, 1145 (2003). [Inspec] [MEDLINE] [ChemPort]
first citation in article
-
J. Lee, A. Liwo, and H. A. Scheraga, Proc. Natl. Acad. Sci. U.S.A. 96, 2025 (1999). [ISI] [MEDLINE] [ChemPort]
first citation in article
-
S. Miyazawa and R. L. Jernigan, Proteins 50, 35 (2003). [MEDLINE]
first citation in article
-
I. Bahar and R. L. Jernigan, Folding Des. 1, 357 (1996). [MEDLINE] [ChemPort]
first citation in article
-
C. Chothia, Nature (London) 254, 304 (1975). [Inspec] [MEDLINE] [ChemPort]
first citation in article
-
C. Chothia and J. Janin, Nature (London) 256, 705 (1975). [Inspec] [ISI] [MEDLINE] [ChemPort]
first citation in article
-
A. G. Murzin, S. E. Brenner, T. Hubbard, and C. Chothia, J. Mol. Biol. 247, 536 (1995). [ISI] [MEDLINE] [ChemPort]
first citation in article
-
C. E. Lawrence, S. F. Altschul, M. S. Boguski, J. S. Liu, A. F. Neuwald, and J. C. Wootton, Science 262, 208 (1993). [ISI] [MEDLINE] [ChemPort]
first citation in article
-
H. M. Berman, J. Westbrook, Z. Feng, G. Gilliland, T. N. Bhat, H. Weissig, I. N. Shindyalov, and P. E. Bourne, Nucleic Acids Res. 28, 235 (2000). [ISI] [MEDLINE] [ChemPort]
first citation in article
-
M. Levitt, J. Mol. Biol. 226, 507 (1992). [ISI] [MEDLINE] [ChemPort]
first citation in article
-
See EPAPS Document No. E-JCPSA6-121-519447 for additional tables. A
direct link to this document may be found in the online article's HTML
reference section. The document may also be reached via the EPAPS
homepage (http://www.aip.org/pubservs/epaps.html) or from ftp.aip.org
in the directory /epaps/. See the EPAPS homepage for more information. [EPAPS]
first citation in article
-
Orientational potentials used here are available on the author's URLs.
first citation in article
FIGURES
Full figure (5 kB)Fig. 1. The definitions of a local coordinate system affixed to each residue. The origin O of the local coordinate system is located at the C position of each residue. The Y and Z axes are ones formed by the vector product and the sum of the unit vectors from N to C and from C to C, respectively. The X axis is taken to form a right-handed coordinate system. The relative direction and rotation of one residue to the other in contacting residues are represented by polar angles (,) and Euler angles (,,), respectively. First citation in article
Full figure (9 kB)Fig. 2. Dependencies of orientational entropies on parameters in the estimation of the orientational potentials. The orientational entropies averaged over all types of residue pairs with the weight of the number of contacts Naa for each type of residue pair are plotted against the cutoff values for the expansion coefficients. Triplets of digits near solid lines indicate the values of (l,l,k); for the non-solid lines, l = l = k = 6 is used. The other parameters are = 0.2 for all lines, and Ocutoff = O33333 = 1792 for solid lines. The dotted line shows the case of Ocutoff = O00777 = 960, the dotted broken line is for Ocutoff = O11555 = 1584, and the broken line is for Ocutoff = O22444 = 2025. First citation in article
Full figure (9 kB)Fig. 3. Dependencies of the number of significant expansion terms on estimation parameters for the orientational potentials. The numbers of significant terms averaged over all types of residue pairs with the weight of the number of contacts Naa for each type of residue pair are plotted against the cutoff values for expansion coefficients. Triplets of digits near curves indicate the values of (l,l,k); for the non-solid lines, l = l = k = 6 is used. The other parameters are = 0.2 for all lines, and Ocutoff = O33333 = 1792 for solid lines. The dotted line shows the case of Ocutoff = O00777 = 960, the dotted broken line is for Ocutoff = O11555 = 1584, and the broken line is for Ocutoff = O22444 = 2025. First citation in article
Full figure (9 kB)Fig. 4. Correlation between the number of significant expansion terms and orientational entropy. Those values for 210 different types of residue pairs, which are averaged over residue pairs (a,a) and (a,a), are plotted here. The orientational potentials are evaluated with l = l = k = 6, Ocutoff = 1792, = 0.2, and ccutoff = 0.025. First citation in article
Full figure (8 kB)Fig. 5. Histograms of the numbers of significant expansion terms for the 210 types of residue pairs; the numbers of significant expansion terms are averaged over residue pairs (a,a) and (a,a). The size of a bin is 200. These data are those for l = l = k = 6, Ocutoff = 1792, = 0.2, and ccutoff = 0.025. First citation in article
Full figure (22 kB)Fig. 6. Orientational entropies, –ln faa, for three types of distributions are plotted against the identification number of amino acid pair (a,a). Amino acid types are numbered in the order of amino acids written along the abscissa; see text for details. The broken line shows the entropy, 6.900, for a uniform distribution. The lowest solid line shows the distribution with polar and Euler angle dependencies, l = l = k = 6. The highest solid line shows the distribution with l = 6,l = k = 0 that depends on polar angles only. The middle solid line shows the distribution that depends on polar angles with l = 6, and on Euler angles with l = k = 6, but ignores any correlation between polar and Euler angles. The values of other parameters are Ocutoff = 1792, = 0.2, and ccutoff = 0.025. First citation in article
Full figure (27 kB)Fig. 7. The effects of Euler angle dependencies in the orientational potentials on the performance for fold recognition. The value of logarithm of rank probability Pe in the energy scale for each decoy set is plotted against the identification number of the decoy set that is listed in Table V and tables in the auxiliary material (Ref. 52). The left figure (a) corresponds to the decoy set group of monomeric proteins in "Decoys'R'Us" (Ref. 39), and the right figure (b) to the immunoglobulin decoy set group. The potential function used here consists of orientational potentials eo only. Cross marks and solid lines show the case for the orientational potential with l = 7, l = k = 0, Ocutoff = ![[infinity]](024901_1_files/infin.gif) , and ccutoff = 0.025. Open circles and broken lines show the case for the orientational potential with l = l = k = 6, Ocutoff = 1792, and ccutoff = 0.025. First citation in article
, and ccutoff = 0.025. Open circles and broken lines show the case for the orientational potential with l = l = k = 6, Ocutoff = 1792, and ccutoff = 0.025. First citation in article
Full figure (28 kB)Fig. 8. The effects of the orientational potentials on performance for fold recognition. The value of logarithm of rank probability Pe in the energy scale for each decoy set is compared between two types of potential functions, one of which includes the orientational potential. The abscissa shows the identification number of each decoy set that is listed in Table V and tables in the auxiliary material (Ref. 52). (a) The potentials for monomeric protein decoy sets consist of e + ec for cross marks and solid lines, and e + ec + eo for open circles and broken lines. (b) The potentials for immunoglobulin decoy sets consist of ec + er for cross marks and solid lines, and eo + er for open circles and broken lines. The orientational energies are evaluated with l = l = k = 6, Ocutoff = 1792, = 0.2, ccutoff = 0.025. First citation in article
TABLES
| Table I. Orientational entropy, –ln faa, in kB units for each residue pair (a,a); a (a) is shown in each row (column), r is for all types of residues, and the parameters used are l = l = k = 6, Ocutoff = 1792, = 0.2, and ccutoff = 0.025. |
| | C | M | F | I | L | V | W | Y | A | G | T | S | Q | N | E | D | H | R | K | P | r |
| C | 3.97 | 4.06 | 4.52 | 4.31 | 4.54 | 4.33 | 3.62 | 4.33 | 4.38 | 4.74 | 4.40 | 4.43 | 4.02 | 4.25 | 3.96 | 4.00 | 3.96 | 4.26 | 4.01 | 4.50 | 5.12 |
| M | 4.07 | 4.47 | 4.69 | 4.44 | 4.58 | 4.45 | 4.23 | 4.64 | 4.50 | 4.88 | 4.48 | 4.57 | 4.24 | 4.42 | 4.15 | 4.16 | 4.21 | 4.35 | 4.04 | 4.78 | 4.97 |
| F | 4.51 | 4.71 | 4.92 | 4.73 | 4.88 | 4.68 | 4.55 | 4.86 | 4.84 | 5.09 | 4.82 | 4.83 | 4.51 | 4.82 | 4.60 | 4.60 | 4.60 | 4.67 | 4.50 | 4.90 | 5.16 |
| I | 4.31 | 4.45 | 4.72 | 4.38 | 4.52 | 4.34 | 4.42 | 4.66 | 4.36 | 4.91 | 4.47 | 4.57 | 4.27 | 4.47 | 4.13 | 4.27 | 4.34 | 4.44 | 4.10 | 4.82 | 4.77 |
| L | 4.53 | 4.57 | 4.88 | 4.52 | 4.68 | 4.55 | 4.60 | 4.78 | 4.43 | 5.01 | 4.62 | 4.64 | 4.35 | 4.65 | 4.20 | 4.41 | 4.68 | 4.56 | 4.28 | 5.06 | 4.86 |
| V | 4.31 | 4.46 | 4.69 | 4.33 | 4.55 | 4.21 | 4.53 | 4.65 | 4.33 | 4.90 | 4.44 | 4.55 | 4.43 | 4.60 | 4.22 | 4.28 | 4.43 | 4.48 | 4.16 | 4.80 | 4.78 |
| W | 3.59 | 4.23 | 4.53 | 4.43 | 4.59 | 4.53 | 3.87 | 4.46 | 4.78 | 4.79 | 4.46 | 4.51 | 4.06 | 4.27 | 4.29 | 4.40 | 4.09 | 4.28 | 4.01 | 4.56 | 5.21 |
| Y | 4.34 | 4.61 | 4.85 | 4.63 | 4.74 | 4.62 | 4.44 | 4.87 | 4.85 | 5.11 | 4.78 | 4.80 | 4.46 | 4.86 | 4.76 | 4.91 | 4.71 | 4.66 | 4.38 | 4.88 | 5.23 |
| A | 4.34 | 4.50 | 4.85 | 4.33 | 4.42 | 4.29 | 4.76 | 4.85 | 3.76 | 4.88 | 4.46 | 4.45 | 4.37 | 4.52 | 4.10 | 4.05 | 4.60 | 4.53 | 4.20 | 4.96 | 4.78 |
| G | 4.70 | 4.88 | 5.12 | 4.89 | 4.98 | 4.88 | 4.84 | 5.13 | 4.88 | 5.47 | 5.12 | 5.31 | 5.00 | 5.30 | 4.90 | 4.95 | 5.06 | 5.22 | 4.97 | 5.35 | 5.61 |
| T | 4.37 | 4.46 | 4.82 | 4.44 | 4.62 | 4.44 | 4.44 | 4.80 | 4.46 | 5.13 | 4.23 | 4.54 | 4.19 | 4.63 | 3.95 | 4.16 | 4.52 | 4.62 | 4.16 | 4.91 | 4.95 |
| S | 4.42 | 4.56 | 4.87 | 4.56 | 4.62 | 4.54 | 4.50 | 4.82 | 4.41 | 5.30 | 4.54 | 4.67 | 4.42 | 4.78 | 4.24 | 4.33 | 4.59 | 4.76 | 4.48 | 4.98 | 5.09 |
| Q | 4.02 | 4.20 | 4.51 | 4.21 | 4.31 | 4.38 | 4.07 | 4.47 | 4.36 | 5.02 | 4.19 | 4.39 | 4.15 | 4.39 | 3.84 | 4.03 | 4.32 | 4.27 | 3.91 | 4.72 | 4.86 |
| N | 4.23 | 4.41 | 4.84 | 4.48 | 4.61 | 4.58 | 4.30 | 4.85 | 4.52 | 5.28 | 4.65 | 4.77 | 4.39 | 4.84 | 4.28 | 4.45 | 4.59 | 4.71 | 4.36 | 4.97 | 5.22 |
| E | 3.96 | 4.12 | 4.59 | 4.12 | 4.19 | 4.18 | 4.29 | 4.81 | 4.10 | 4.93 | 3.95 | 4.22 | 3.81 | 4.29 | 3.72 | 3.83 | 4.58 | 4.39 | 4.06 | 4.54 | 4.71 |
| D | 3.96 | 4.14 | 4.61 | 4.24 | 4.38 | 4.28 | 4.42 | 4.95 | 4.06 | 4.95 | 4.14 | 4.32 | 4.03 | 4.44 | 3.83 | 4.13 | 4.71 | 4.85 | 4.46 | 4.67 | 4.95 |
| H | 3.98 | 4.20 | 4.58 | 4.33 | 4.66 | 4.43 | 4.09 | 4.73 | 4.60 | 5.07 | 4.51 | 4.53 | 4.30 | 4.60 | 4.58 | 4.71 | 4.40 | 4.44 | 4.18 | 4.63 | 5.27 |
| R | 4.26 | 4.36 | 4.68 | 4.42 | 4.55 | 4.46 | 4.31 | 4.72 | 4.54 | 5.25 | 4.63 | 4.75 | 4.27 | 4.73 | 4.37 | 4.87 | 4.47 | 4.66 | 4.05 | 4.88 | 5.08 |
| K | 3.97 | 4.06 | 4.51 | 4.09 | 4.26 | 4.15 | 3.99 | 4.42 | 4.22 | 5.00 | 4.19 | 4.49 | 3.94 | 4.38 | 4.06 | 4.48 | 4.18 | 4.07 | 3.85 | 4.53 | 4.81 |
| P | 4.47 | 4.76 | 4.94 | 4.80 | 5.06 | 4.79 | 4.59 | 4.91 | 4.97 | 5.35 | 4.89 | 4.96 | 4.76 | 5.00 | 4.58 | 4.66 | 4.68 | 4.89 | 4.54 | 5.19 | 5.48 |
| r | 5.11 | 4.97 | 5.15 | 4.77 | 4.86 | 4.77 | 5.21 | 5.24 | 4.78 | 5.61 | 4.96 | 5.09 | 4.88 | 5.23 | 4.72 | 4.96 | 5.26 | 5.08 | 4.81 | 5.48 | 5.18 |
First citation in article
| Table II. Dependencies of the performance of fold recognition on the resolution of the orientational potential; dependencies on polar or Euler angles. |
| (a) Dependencies on polar angles |
l | ccutoff | l = k = 0, = 0.2, Ocutoff = |
| 79 monomeric decoy sets | 81 Ig decoy sets |
| No. of tops | | |  | No. of tops | | | |
| 4 | 0.0 | 23 | –2.79 | –2.09 | –1.41 | 29 | –2.66 | –1.88 | –1.45 |
| | 0.025 | 22 | –2.77 | –2.02 | –1.41 | 28 | –2.67 | –1.82 | –1.45 |
| 5 | 0.0 | 31 | –3.35 | –2.57 | –1.84 | 31 | –2.68 | –1.96 | –1.46 |
| | 0.025 | 31 | –3.37 | –2.57 | –1.84 | 30 | –2.66 | –1.93 | –1.45 |
| 6 | 0.0 | 27 | –3.23 | –2.55 | –1.77 | 34 | –2.69 | –2.19 | –1.45 |
| | 0.025 | 28 | –3.24 | –2.58 | –1.76 | 34 | –2.68 | –2.16 | –1.44 |
| 7 | 0.0 | 30 | –3.45 | –2.60 | –1.98 | 45 | –2.93 | –2.52 | –1.57 |
| | 0.025 | 31 | –3.46 | –2.60 | –1.98 | 45 | –2.94 | –2.53 | –1.58 |
| 8 | 0.0 | 28 | –3.37 | –2.59 | –1.91 | 38 | –2.73 | –2.24 | –1.48 |
| | 0.025 | 27 | –3.36 | –2.55 | –1.89 | 39 | –2.74 | –2.27 | –1.49 |
| 9 | 0.0 | 25 | –3.38 | –2.43 | –1.92 | 32 | –2.66 | –2.06 | –1.54 |
| | 0.025 | 24 | –3.36 | –2.44 | –1.90 | 33 | –2.68 | –2.08 | –1.56 |
| 10 | 0.0 | 27 | –3.32 | –2.55 | –1.83 | 37 | –2.55 | –2.13 | –1.52 |
| | 0.025 | 26 | –3.31 | –2.49 | –1.82 | 36 | –2.52 | –2.14 | –1.55 |
| 11 | 0.0 | 28 | –3.44 | –2.67 | –1.94 | 39 | –2.68 | –2.16 | –1.71 |
| | 0.025 | 30 | –3.48 | –2.82 | –1.92 | 39 | –2.67 | –2.18 | –1.72 |
| 12 | 0.0 | 25 | –3.29 | –2.45 | –1.78 | 41 | –2.70 | –2.29 | –1.76 |
| | 0.025 | 24 | –3.30 | –2.50 | –1.77 | 40 | –2.70 | –2.29 | –1.77 |
| 13 | 0.0 | 30 | –3.39 | –2.73 | –1.80 | 39 | –2.80 | –2.19 | –1.83 |
| | 0.025 | 29 | –3.38 | –2.73 | –1.80 | 40 | –2.80 | –2.20 | –1.83 |
| 14 | 0.0 | 31 | –3.42 | –2.89 | –1.84 | 46 | –2.87 | –2.48 | –1.91 |
| | 0.025 | 30 | –3.44 | –2.82 | –1.82 | 47 | –2.89 | –2.53 | –1.89 |
| (b) Dependencies on Euler angles |
l
k | ccutoff | l = 0, = 0.2, Ocutoff = |
| 79 monomeric decoy sets | 81 Ig decoy sets |
| No. of tops | | | | No. of tops | | | |
| 4 | 0.0 | 25 | –3.18 | –2.68 | –1.78 | 33 | –2.63 | –2.26 | –1.31 |
| | 0.025 | 25 | –3.14 | –2.71 | –1.75 | 33 | –2.61 | –2.31 | –1.29 |
| 5 | 0.0 | 25 | –3.26 | –2.79 | –1.77 | 44 | –2.85 | –2.55 | –1.65 |
| | 0.025 | 26 | –3.23 | –2.80 | –1.74 | 44 | –2.84 | –2.58 | –1.61 |
| 6 | 0.0 | 26 | –3.25 | –2.79 | –1.83 | 47 | –3.04 | –2.78 | –1.84 |
| | 0.025 | 24 | –3.20 | –2.57 | –1.81 | 45 | –3.00 | –2.79 | –1.77 |
| 7 | 0.0 | 30 | –3.31 | –2.84 | –1.88 | 52 | –3.03 | –2.94 | –1.82 |
| | 0.025 | 28 | –3.24 | –2.70 | –1.83 | 52 | –3.02 | –2.92 | –1.73 |
First citation in article
| Table III. Dependencies of the performance of fold recognition on the resolution of the orientational potential; interdependencies between polar and Euler angles. |
| (a) Dependencies on lmax and cutoff Ocutoff |
| l | Ocutoff | l = k = l, = 0.2, ccutoff = 0.025 |
| 79 monomeric decoy sets | 81 Ig decoy sets |
| No. of tops | | | | No. of tops | | | |
| 4 | 960 | 34 | –3.72 | –3.24 | –2.18 | 47 | –2.97 | –2.81 | –1.59 |
| | 1792 | 36 | –3.77 | –3.27 | –2.21 | 47 | –3.01 | –2.79 | –1.67 |
| 5 | 960 | 36 | –3.82 | –3.38 | –2.27 | 56 | –3.18 | –3.02 | –1.81 |
| | 1792 | 38 | –3.87 | –3.22 | –2.33 | 55 | –3.23 | –2.92 | –1.96 |
| 6 | 960 | 37 | –3.83 | –3.33 | –2.32 | 60 | –3.24 | –3.23 | –1.92 |
| | 1792 | 37 | –3.88 | –3.22 | –2.38 | 59 | –3.27 | –3.11 | –2.00 |
| | 2025 | 38 | –3.85 | –3.25 | –2.36 | 56 | –3.21 | –3.05 | –1.99 |
| 7 | 64 | 27 | –3.53 | –2.95 | –1.93 | 30 | –2.63 | –2.04 | –1.46 |
| | 960 | 36 | –3.85 | –3.22 | –2.34 | 57 | –3.22 | –3.11 | –1.93 |
| | 1792 | 38 | –3.91 | –3.31 | –2.42 | 53 | –3.20 | –2.94 | –2.02 |
| | 2025 | 37 | –3.87 | –3.29 | –2.40 | 54 | –3.20 | –3.02 | –2.04 |
| (b) Dependencies on cutoff ccutoff |
| | | l = k = l, = 0.2, Ocutoff = 960 |
| l | ccutoff | 79 monomeric decoy sets | 81 Ig decoy sets |
| No. of tops | | | | No. of tops | | | |
| 5 | 0.0 | 35 | –3.81 | –3.33 | –2.27 | 55 | –3.17 | –2.96 | –1.83 |
| | 0.025 | 36 | –3.82 | –3.38 | –2.27 | 56 | –3.18 | –3.02 | –1.81 |
| 6 | 0.0 | 34 | –3.80 | –3.24 | –2.32 | 60 | –3.26 | –3.25 | –1.95 |
| | 0.025 | 37 | –3.83 | –3.33 | –2.32 | 60 | –3.24 | –3.23 | –1.92 |
| 7 | 0.0 | 34 | –3.82 | –3.11 | –2.33 | 59 | –3.25 | –3.17 | –1.96 |
| | 0.025 | 36 | –3.85 | –3.22 | –2.34 | 57 | –3.22 | –3.11 | –1.93 |
| l | ccutoff | l = k = l, = 0.2, Ocutoff = 1792 |
| 5 | 0.0 | 38 | –3.88 | –3.30 | –2.34 | 56 | –3.23 | –2.93 | –1.96 |
| | 0.025 | 38 | –3.87 | –3.22 | –2.33 | 55 | –3.23 | –2.92 | –1.96 |
| 6 | 0.0 | 37 | –3.87 | –3.35 | –2.40 | 60 | –3.28 | –3.14 | –2.01 |
| | 0.025 | 37 | –3.88 | –3.22 | –2.38 | 59 | –3.27 | –3.11 | –2.00 |
| 7 | 0.0 | 39 | –3.92 | –3.27 | –2.43 | 55 | –3.20 | –3.05 | –2.05 |
| | 0.025 | 38 | –3.91 | –3.31 | –2.42 | 53 | –3.20 | –2.94 | –2.02 |
| (c) Dependencies on a parameter for small sample correction, |
| | | l = l = k = 6, ccutoff = 0.025 |
| Ocutoff | | 79 monomeric decoy sets | 81 Ig decoy sets |
| No. of tops | | | | No. of tops | | | |
| 960 | 0.1 | 35 | –3.82 | –3.26 | –2.32 | 60 | –3.25 | –3.23 | –1.93 |
| | 0.2 | 37 | –3.83 | –3.33 | –2.32 | 60 | –3.24 | –3.23 | –1.92 |
| | 1 | 34 | –3.78 | –3.23 | –2.28 | 58 | –3.22 | –3.19 | –1.89 |
| 1792 | 0.1 | 36 | –3.86 | –3.15 | –2.39 | 59 | –3.27 | –3.11 | –2.00 |
| | 0.2 | 37 | –3.88 | –3.22 | –2.38 | 59 | –3.27 | –3.11 | –2.00 |
| | 1 | 36 | –3.85 | –3.18 | –2.34 | 57 | –3.24 | –3.05 | –1.97 |
First citation in article
| Table IV. Performance of each potential component in fold recognition. |
| (a) For the 79 monomeric decoy sets |
| Potentialsa | No. of top ranks | Mean | Mean | Mean | Mean | Median | Median | Mean |
| e | | e | | eo | | er | | es | Total No. = 79 | | | |  | Ze | Zrmsd |  b b |
| | | | | eo | | | | | 37 | –3.88 | –3.22 | –2.38 | –2.49 | –2.09 | –1.65 | 0.33 |
| | | | | eo | + | er | | | 35 | –3.79 | –3.08 | –2.32 | –2.33 | –2.01 | –1.49 | 0.33 |
| | | | | eo | + | | | es | 53 | –4.00 | –3.99 | –2.96 | –3.13 | –3.22 | –2.59 | 0.35 |
| | | | | eo | + | er | + | es | 53 | –3.98 | –3.99 | –2.93 | –3.13 | –3.16 | –2.59 | 0.34 |
| | | ec | | | | | | | 36 | –4.12 | –3.20 | –2.56 | –2.12 | –2.37 | –1.63 | 0.33 |
| | | ec | + | | | er | | | 41 | –3.90 | –3.12 | –2.23 | –2.03 | –2.04 | –1.74 | 0.32 |
| | | ec | + | eo | | | | | 52 | –4.53 | –4.24 | –3.18 | –3.19 | –2.79 | –2.60 | 0.37 |
| | | ec | + | eo | + | er | | | 52 | –4.38 | –4.04 | –2.95 | –3.01 | –2.54 | –2.50 | 0.37 |
| | | ec | + | eo | + | | | es | 58 | –4.25 | –4.30 | –3.51 | –3.38 | –3.48 | –3.04 | 0.37 |
| | | ec | + | eo | + | er | + | es | 57 | –4.15 | –4.24 | –3.35 | –3.35 | –3.17 | –2.80 | 0.37 |
| e | + | ec | | | | | | | 36 | –4.05 | –3.29 | –2.68 | –2.32 | –2.61 | –1.86 | 0.32 |
| e | + | ec | + | | | er | | | 38 | –4.18 | –3.50 | –2.53 | –2.50 | –2.49 | –2.14 | 0.32 |
| e | + | ec | + | eo | | | | | 58 | –4.79 | –4.88 | –4.38 | –3.92 | –4.08 | –3.55 | 0.40 |
| e | + | ec | + | eo | + | er | | | 57 | –4.73 | –4.69 | –4.13 | –3.74 | –3.76 | –3.41 | 0.40 |
| e | + | ec | + | eo | + | | | es | 61 | –4.63 | –4.63 | –4.45 | –3.68 | –4.11 | –3.41 | 0.39 |
| e | + | ec | + | eo | + | er | + | es | 59 | –4.49 | –4.49 | –4.21 | –3.56 | –3.86 | –3.10 | 0.39 |
| (b) For the 81 immunogloblin decoy sets |
| Potentialsa | No. of top ranks | Mean | Mean | Mean | Mean | Median | Median | Mean |
| e | | e | | eo | | er | | es | Total No. = 81 | | | | | Ze | Zrmsd | b |
| | | | | eo | | | | | 59 | –3.27 | –3.11 | –2.00 | –2.74 | –2.03 | –2.55 | 0.38 |
| | | | | eo | + | er | | | 62 | –3.35 | –3.23 | –2.15 | –2.85 | –2.27 | –2.61 | 0.36 |
| | | | | eo | + | | | es | 67 | –3.36 | –3.42 | –3.14 | –3.00 | –3.27 | –2.69 | 0.39 |
| | | | | eo | + | er | + | es | 68 | –3.38 | –3.46 | –3.29 | –3.03 | –3.44 | –2.71 | 0.37 |
| | | ec | | | | | | | 6 | –1.55 | –1.38 | –0.52 | –0.65 | –0.51 | –0.47 | 0.38 |
| | | ec | + | | | er | | | 36 | –2.78 | –2.29 | –1.02 | –1.70 | –0.95 | –1.15 | 0.29 |
| | | ec | + | eo | | | | | 57 | –3.20 | –3.09 | –1.57 | –2.70 | –1.55 | –2.53 | 0.44 |
| | | ec | + | eo | + | er | | | 63 | –3.39 | –3.35 | –1.82 | –2.95 | –1.79 | –2.67 | 0.40 |
| | | ec | + | eo | + | | | es | 68 | –3.36 | –3.50 | –2.53 | –3.09 | –2.44 | –2.69 | 0.43 |
| | | ec | + | eo | + | er | + | es | 69 | –3.39 | –3.52 | –2.81 | –3.09 | –2.81 | –2.71 | 0.40 |
| e | + | ec | | | | | | | 0 | –0.40 | –1.33 | 0.54 | –0.46 | 0.44 | –0.49 | 0.35 |
| e | + | ec | + | | | er | | | 0 | –0.44 | –1.29 | 0.35 | –0.50 | 0.24 | –0.49 | 0.32 |
| e | + | ec | + | eo | | | | | 19 | –2.11 | –2.08 | –0.86 | –1.26 | –0.89 | –0.79 | 0.50 |
| e | + | ec | + | eo | + | er | | | 44 | –2.82 | –2.81 | –1.20 | –2.22 | –1.25 | –2.13 | 0.48 |
| e | + | ec | + | eo | + | | | es | 55 | –3.00 | –3.10 | –1.83 | –2.63 | –1.94 | –2.53 | 0.49 |
| e | + | ec | + | eo | + | er | + | es | 61 | –3.24 | –3.31 | –2.25 | –2.82 | –2.34 | –2.61 | 0.46 |
| a The orientational energies used above are calculated with l = l = k = 6, Ocutoff = 1792, = 0.2, and ccutoff = 0.025. |
| b R is the correlation coefficient of rank order between the energies and RMSDs of decoys in a decoy set. |
First citation in article
| Table V. The performance of scoring functions for each family of protein decoy sets. |
Decoy ID range, decoy family
potentials | No. of tops
/Total No. | Mean
| Mean
| Mean
a |
| 1-7 4state_reduced: seven decoy sets |
| (e + ec + eo + es)b | 7/7 | –6.50 | –4.44 | 0.66 |
| Fain et al. (2002)c | 1/7 | –4.45 | –2.3 | 0.52 |
| Toby and Elber (2000)d | 3/6 | –5.42 | –3.14 | |
| Samudrala and Moult (1998)e | 6/7 | –6.06 | –2.67 | 0.67 |
| Onizuka et al. (2002)f | 7/7 | –6.50 | –3.41 | |
| Dominy and Brooks (2002)g | ~7/7 | ~–6.5 | –3.4 | 0.55 |
| 8–11 fisa: four decoy sets |
| (e + ec + eo + es)b | 2/4 | –4.04 | –2.55 | 0.26 |
| Toby and Elbner (2000)d | 2/3 | | –3.34 | |
| Onizuka et al. (2002)f | 1/3 | | –1.38 | |
| 12–16 fisa_casp3: five decoy sets |
| (e + ec + eo + es)b | 2/5 | –5.38 | –3.61 | 0.16 |
| Toby and Elber (2000)d | 1/3 | | –3.94 | |
| Onizuka et al. (2002)f | 1/3 | | –2.01 | |
| 17–45 hg_structal: 29 decoy sets |
| (e + ec + eo + es)b | 22/29 | –2.76 | –2.62 | 0.72 |
| Dominy and Brooks (2002)g | 19/29 | | –2.0 | 0.69 |
| 46–53 lattice_ssfit: eight decoy sets |
| (e + ec + eo + es)b | 8/8 | –7.60 | –11.12 | –0.01 |
| Fain et al. (2002)c | 8/8 | –7.60 | –6.84 | |
| Toby and Elber (2000)d | 4/6 | –6.89 | –4.10 | |
| Samudrala and Moult (1998)e | 8/8 | –7.60 | –6.46 | |
| Onizuka et al. (2002)f | 6/6 | –7.60 | –6.22 | |
| 54–63 lmds: ten decoy sets |
| (e + ec + eo + es)b | 8/10 | –4.89 | –5.34 | 0.14 |
| Fain et al. (2002)c | 3/9 | –4.55 | –2.83 | |
| Toby and Elber (2000)d | 4/7 | –5.32 | –3.27 | |
| Samudrala and Moult (1998)e | 3/9 | –3.04 | –0.58 | |
| Onizuka et al. (2002)f | 5/7 | –5.00 | –3.67 | |
| 64–73 lmds_v2: ten decoy sets |
| (e + ec + eo + es)b | 8/10 | –3.85 | –5.03 | 0.18 |
| Fain et al. (2002)c | 1/2 | –4.81 | –3.15 | |
| Samudrala and Moult (1998)e | 1/2 | –4.47 | –3.05 | |
| 74–79 semfold: six decoy sets |
| (e + ec + eo + es)b | 4/6 | –8.13 | –3.86 | 0.08 |
| 1–61 ig_structal: 61 dcoy sets |
| (eo + er + es)b | 49/61 | –3.55 | –2.96 | 0.36 |
| 62–81 ig_structal_hires: 20 decoy sets |
| (eo + er + es)b | 19/20 | –2.86 | –4.31 | 0.43 |
| a R is the correlation coefficient of rank order between the energies and RMSDs of decoys in a decoy set. |
| b The present model; the orientational energies were calculated with l = l = k = 6, Ocutoff = 1792, = 0.2, and ccutoff = 0.025. |
| c Reference 25. |
| d Reference 24. |
| e Reference 13; taken from Ref. 25. |
| f Reference 33; the distance-dependent angular potential named 3C326. |
| g Reference 18; generalized Born, Coulomb, nonpolar solvation, and van der Waals energy terms are included. |
First citation in articleFOOTNOTES
aElectronic mail: miyazawa@smlab.sci.gunma-u.ac.jp; URL: https://www.smlab.sci.gunma-u.ac.jp/~miyazawa/
bElectronic mail: jernigan@iastate.edu; URL: http://ribosome.bb.iastate.edu/
Up: Issue Table of Contents
Go to: Previous Article | Next Article
Other formats: HTML (smaller files) | PDF (245 kB)
 Full figure (5 kB)
 Full figure (9 kB)
 Full figure (9 kB)
 Full figure (9 kB)
 Full figure (8 kB)
 Full figure (22 kB)
 Full figure (27 kB)
 Full figure (28 kB)
![[ISI]](http://link.aip.org/link/?&l_creator=fthtml&l_dir=FWD&l_rel=CITES&from_key=JCPSA6000122000002024901000001&from_keyType=CVIPS&from_loc=AIP&to_j=MAMOBX&to_v=18&to_p=534&to_loc=ISI&to_url=http%3A%2F%2Flinks.isiglobalnet2.com%2Fgateway%2FGateway.cgi%3FGWVersion%3D2%26SrcAuth%3DAIP%26SrcApp%3DAIP%26DestLinkType%3DFullRecord%26KeyUT%3DA1985AEC7700039%26DestApp%3DWOS_CPL%26SrcURL%3Dhttp%253A%252F%252Flink.aip.org%252Flink%252F%253FJCP%252F122%252F024901%252F1%26SrcImageURL%3Dhttp%253A%252F%252Fisilinks.com%253A9000%252FLinks%252Fimages%252FAIP_Ret.gif)
![[ISI]](http://link.aip.org/link/?&l_creator=fthtml&l_dir=FWD&l_rel=CITES&from_key=JCPSA6000122000002024901000001&from_keyType=CVIPS&from_loc=AIP&to_j=JMOBAK&to_v=256&to_p=623&to_loc=ISI&to_url=http%3A%2F%2Flinks.isiglobalnet2.com%2Fgateway%2FGateway.cgi%3FGWVersion%3D2%26SrcAuth%3DAIP%26SrcApp%3DAIP%26DestLinkType%3DFullRecord%26KeyUT%3DA1996TW70200019%26DestApp%3DWOS_CPL%26SrcURL%3Dhttp%253A%252F%252Flink.aip.org%252Flink%252F%253FJCP%252F122%252F024901%252F1%26SrcImageURL%3Dhttp%253A%252F%252Fisilinks.com%253A9000%252FLinks%252Fimages%252FAIP_Ret.gif)
![[ISI]](http://link.aip.org/link/?&l_creator=fthtml&l_dir=FWD&l_rel=CITES&from_key=JCPSA6000122000002024901000001&from_keyType=CVIPS&from_loc=AIP&to_j=18PLAF&to_v=34&to_p=49&to_loc=ISI&to_url=http%3A%2F%2Flinks.isiglobalnet2.com%2Fgateway%2FGateway.cgi%3FGWVersion%3D2%26SrcAuth%3DAIP%26SrcApp%3DAIP%26DestLinkType%3DFullRecord%26KeyUT%3D000077711200005%26DestApp%3DWOS_CPL%26SrcURL%3Dhttp%253A%252F%252Flink.aip.org%252Flink%252F%253FJCP%252F122%252F024901%252F1%26SrcImageURL%3Dhttp%253A%252F%252Fisilinks.com%253A9000%252FLinks%252Fimages%252FAIP_Ret.gif)
![[ISI]](http://link.aip.org/link/?&l_creator=fthtml&l_dir=FWD&l_rel=CITES&from_key=JCPSA6000122000002024901000001&from_keyType=CVIPS&from_loc=AIP&to_j=18PLAF&to_v=36&to_p=347&to_loc=ISI&to_url=http%3A%2F%2Flinks.isiglobalnet2.com%2Fgateway%2FGateway.cgi%3FGWVersion%3D2%26SrcAuth%3DAIP%26SrcApp%3DAIP%26DestLinkType%3DFullRecord%26KeyUT%3D000081658200009%26DestApp%3DWOS_CPL%26SrcURL%3Dhttp%253A%252F%252Flink.aip.org%252Flink%252F%253FJCP%252F122%252F024901%252F1%26SrcImageURL%3Dhttp%253A%252F%252Fisilinks.com%253A9000%252FLinks%252Fimages%252FAIP_Ret.gif)
![[ISI]](http://link.aip.org/link/?&l_creator=fthtml&l_dir=FWD&l_rel=CITES&from_key=JCPSA6000122000002024901000001&from_keyType=CVIPS&from_loc=AIP&to_j=18PLAF&to_v=36&to_p=357&to_loc=ISI&to_url=http%3A%2F%2Flinks.isiglobalnet2.com%2Fgateway%2FGateway.cgi%3FGWVersion%3D2%26SrcAuth%3DAIP%26SrcApp%3DAIP%26DestLinkType%3DFullRecord%26KeyUT%3D000081658200010%26DestApp%3DWOS_CPL%26SrcURL%3Dhttp%253A%252F%252Flink.aip.org%252Flink%252F%253FJCP%252F122%252F024901%252F1%26SrcImageURL%3Dhttp%253A%252F%252Fisilinks.com%253A9000%252FLinks%252Fimages%252FAIP_Ret.gif)
![[ISI]](http://link.aip.org/link/?&l_creator=fthtml&l_dir=FWD&l_rel=CITES&from_key=JCPSA6000122000002024901000001&from_keyType=CVIPS&from_loc=AIP&to_j=JMOBAK&to_v=213&to_p=859&to_loc=ISI&to_url=http%3A%2F%2Flinks.isiglobalnet2.com%2Fgateway%2FGateway.cgi%3FGWVersion%3D2%26SrcAuth%3DAIP%26SrcApp%3DAIP%26DestLinkType%3DFullRecord%26KeyUT%3DA1990DK85400029%26DestApp%3DWOS_CPL%26SrcURL%3Dhttp%253A%252F%252Flink.aip.org%252Flink%252F%253FJCP%252F122%252F024901%252F1%26SrcImageURL%3Dhttp%253A%252F%252Fisilinks.com%253A9000%252FLinks%252Fimages%252FAIP_Ret.gif)
![[ISI]](http://link.aip.org/link/?&l_creator=fthtml&l_dir=FWD&l_rel=CITES&from_key=JCPSA6000122000002024901000001&from_keyType=CVIPS&from_loc=AIP&to_j=PRCIEI&to_v=4&to_p=2107&to_loc=ISI&to_url=http%3A%2F%2Flinks.isiglobalnet2.com%2Fgateway%2FGateway.cgi%3FGWVersion%3D2%26SrcAuth%3DAIP%26SrcApp%3DAIP%26DestLinkType%3DFullRecord%26KeyUT%3DA1995RZ76600016%26DestApp%3DWOS_CPL%26SrcURL%3Dhttp%253A%252F%252Flink.aip.org%252Flink%252F%253FJCP%252F122%252F024901%252F1%26SrcImageURL%3Dhttp%253A%252F%252Fisilinks.com%253A9000%252FLinks%252Fimages%252FAIP_Ret.gif)
![[ISI]](http://link.aip.org/link/?&l_creator=fthtml&l_dir=FWD&l_rel=CITES&from_key=JCPSA6000122000002024901000001&from_keyType=CVIPS&from_loc=AIP&to_j=JMOBAK&to_v=267&to_p=207&to_loc=ISI&to_url=http%3A%2F%2Flinks.isiglobalnet2.com%2Fgateway%2FGateway.cgi%3FGWVersion%3D2%26SrcAuth%3DAIP%26SrcApp%3DAIP%26DestLinkType%3DFullRecord%26KeyUT%3DA1997WP14300018%26DestApp%3DWOS_CPL%26SrcURL%3Dhttp%253A%252F%252Flink.aip.org%252Flink%252F%253FJCP%252F122%252F024901%252F1%26SrcImageURL%3Dhttp%253A%252F%252Fisilinks.com%253A9000%252FLinks%252Fimages%252FAIP_Ret.gif)
![[ISI]](http://link.aip.org/link/?&l_creator=fthtml&l_dir=FWD&l_rel=CITES&from_key=JCPSA6000122000002024901000001&from_keyType=CVIPS&from_loc=AIP&to_j=JMOBAK&to_v=275&to_p=895&to_loc=ISI&to_url=http%3A%2F%2Flinks.isiglobalnet2.com%2Fgateway%2FGateway.cgi%3FGWVersion%3D2%26SrcAuth%3DAIP%26SrcApp%3DAIP%26DestLinkType%3DFullRecord%26KeyUT%3D000072106700014%26DestApp%3DWOS_CPL%26SrcURL%3Dhttp%253A%252F%252Flink.aip.org%252Flink%252F%253FJCP%252F122%252F024901%252F1%26SrcImageURL%3Dhttp%253A%252F%252Fisilinks.com%253A9000%252FLinks%252Fimages%252FAIP_Ret.gif)
![[ISI]](http://link.aip.org/link/?&l_creator=fthtml&l_dir=FWD&l_rel=CITES&from_key=JCPSA6000122000002024901000001&from_keyType=CVIPS&from_loc=AIP&to_j=JCCHDD&to_v=18&to_p=849&to_loc=ISI&to_url=http%3A%2F%2Flinks.isiglobalnet2.com%2Fgateway%2FGateway.cgi%3FGWVersion%3D2%26SrcAuth%3DAIP%26SrcApp%3DAIP%26DestLinkType%3DFullRecord%26KeyUT%3DA1997WT80000001%26DestApp%3DWOS_CPL%26SrcURL%3Dhttp%253A%252F%252Flink.aip.org%252Flink%252F%253FJCP%252F122%252F024901%252F1%26SrcImageURL%3Dhttp%253A%252F%252Fisilinks.com%253A9000%252FLinks%252Fimages%252FAIP_Ret.gif)
![[ISI]](http://link.aip.org/link/?&l_creator=fthtml&l_dir=FWD&l_rel=CITES&from_key=JCPSA6000122000002024901000001&from_keyType=CVIPS&from_loc=AIP&to_j=JCCHDD&to_v=18&to_p=874&to_loc=ISI&to_url=http%3A%2F%2Flinks.isiglobalnet2.com%2Fgateway%2FGateway.cgi%3FGWVersion%3D2%26SrcAuth%3DAIP%26SrcApp%3DAIP%26DestLinkType%3DFullRecord%26KeyUT%3DA1997WT80000002%26DestApp%3DWOS_CPL%26SrcURL%3Dhttp%253A%252F%252Flink.aip.org%252Flink%252F%253FJCP%252F122%252F024901%252F1%26SrcImageURL%3Dhttp%253A%252F%252Fisilinks.com%253A9000%252FLinks%252Fimages%252FAIP_Ret.gif)
![[ISI]](http://link.aip.org/link/?&l_creator=fthtml&l_dir=FWD&l_rel=CITES&from_key=JCPSA6000122000002024901000001&from_keyType=CVIPS&from_loc=AIP&to_j=JCCHDD&to_v=19&to_p=259&to_loc=ISI&to_url=http%3A%2F%2Flinks.isiglobalnet2.com%2Fgateway%2FGateway.cgi%3FGWVersion%3D2%26SrcAuth%3DAIP%26SrcApp%3DAIP%26DestLinkType%3DFullRecord%26KeyUT%3D000071747800001%26DestApp%3DWOS_CPL%26SrcURL%3Dhttp%253A%252F%252Flink.aip.org%252Flink%252F%253FJCP%252F122%252F024901%252F1%26SrcImageURL%3Dhttp%253A%252F%252Fisilinks.com%253A9000%252FLinks%252Fimages%252FAIP_Ret.gif)
![[ISI]](http://link.aip.org/link/?&l_creator=fthtml&l_dir=FWD&l_rel=CITES&from_key=JCPSA6000122000002024901000001&from_keyType=CVIPS&from_loc=AIP&to_j=JCCHDD&to_v=23&to_p=147&to_loc=ISI&to_url=http%3A%2F%2Flinks.isiglobalnet2.com%2Fgateway%2FGateway.cgi%3FGWVersion%3D2%26SrcAuth%3DAIP%26SrcApp%3DAIP%26DestLinkType%3DFullRecord%26KeyUT%3D000172934800016%26DestApp%3DWOS_CPL%26SrcURL%3Dhttp%253A%252F%252Flink.aip.org%252Flink%252F%253FJCP%252F122%252F024901%252F1%26SrcImageURL%3Dhttp%253A%252F%252Fisilinks.com%253A9000%252FLinks%252Fimages%252FAIP_Ret.gif)
![[ISI]](http://link.aip.org/link/?&l_creator=fthtml&l_dir=FWD&l_rel=CITES&from_key=JCPSA6000122000002024901000001&from_keyType=CVIPS&from_loc=AIP&to_j=BICHAW&to_v=30&to_p=4232&to_loc=ISI&to_url=http%3A%2F%2Flinks.isiglobalnet2.com%2Fgateway%2FGateway.cgi%3FGWVersion%3D2%26SrcAuth%3DAIP%26SrcApp%3DAIP%26DestLinkType%3DFullRecord%26KeyUT%3DA1991FK23400018%26DestApp%3DWOS_CPL%26SrcURL%3Dhttp%253A%252F%252Flink.aip.org%252Flink%252F%253FJCP%252F122%252F024901%252F1%26SrcImageURL%3Dhttp%253A%252F%252Fisilinks.com%253A9000%252FLinks%252Fimages%252FAIP_Ret.gif)
![[ISI]](http://link.aip.org/link/?&l_creator=fthtml&l_dir=FWD&l_rel=CITES&from_key=JCPSA6000122000002024901000001&from_keyType=CVIPS&from_loc=AIP&to_j=JMOBAK&to_v=227&to_p=876&to_loc=ISI&to_url=http%3A%2F%2Flinks.isiglobalnet2.com%2Fgateway%2FGateway.cgi%3FGWVersion%3D2%26SrcAuth%3DAIP%26SrcApp%3DAIP%26DestLinkType%3DFullRecord%26KeyUT%3DA1992JW69900019%26DestApp%3DWOS_CPL%26SrcURL%3Dhttp%253A%252F%252Flink.aip.org%252Flink%252F%253FJCP%252F122%252F024901%252F1%26SrcImageURL%3Dhttp%253A%252F%252Fisilinks.com%253A9000%252FLinks%252Fimages%252FAIP_Ret.gif)
![[ISI]](http://link.aip.org/link/?&l_creator=fthtml&l_dir=FWD&l_rel=CITES&from_key=JCPSA6000122000002024901000001&from_keyType=CVIPS&from_loc=AIP&to_j=JMOBAK&to_v=264&to_p=1164&to_loc=ISI&to_url=http%3A%2F%2Flinks.isiglobalnet2.com%2Fgateway%2FGateway.cgi%3FGWVersion%3D2%26SrcAuth%3DAIP%26SrcApp%3DAIP%26DestLinkType%3DFullRecord%26KeyUT%3DA1996VZ95100024%26DestApp%3DWOS_CPL%26SrcURL%3Dhttp%253A%252F%252Flink.aip.org%252Flink%252F%253FJCP%252F122%252F024901%252F1%26SrcImageURL%3Dhttp%253A%252F%252Fisilinks.com%253A9000%252FLinks%252Fimages%252FAIP_Ret.gif)
![[ISI]](http://link.aip.org/link/?&l_creator=fthtml&l_dir=FWD&l_rel=CITES&from_key=JCPSA6000122000002024901000001&from_keyType=CVIPS&from_loc=AIP&to_j=18PLAF&to_v=40&to_p=71&to_loc=ISI&to_url=http%3A%2F%2Flinks.isiglobalnet2.com%2Fgateway%2FGateway.cgi%3FGWVersion%3D2%26SrcAuth%3DAIP%26SrcApp%3DAIP%26DestLinkType%3DFullRecord%26KeyUT%3D000087412000009%26DestApp%3DWOS_CPL%26SrcURL%3Dhttp%253A%252F%252Flink.aip.org%252Flink%252F%253FJCP%252F122%252F024901%252F1%26SrcImageURL%3Dhttp%253A%252F%252Fisilinks.com%253A9000%252FLinks%252Fimages%252FAIP_Ret.gif)
![[ISI]](http://link.aip.org/link/?&l_creator=fthtml&l_dir=FWD&l_rel=CITES&from_key=JCPSA6000122000002024901000001&from_keyType=CVIPS&from_loc=AIP&to_j=18PLAF&to_v=41&to_p=40&to_loc=ISI&to_url=http%3A%2F%2Flinks.isiglobalnet2.com%2Fgateway%2FGateway.cgi%3FGWVersion%3D2%26SrcAuth%3DAIP%26SrcApp%3DAIP%26DestLinkType%3DFullRecord%26KeyUT%3D000089066700006%26DestApp%3DWOS_CPL%26SrcURL%3Dhttp%253A%252F%252Flink.aip.org%252Flink%252F%253FJCP%252F122%252F024901%252F1%26SrcImageURL%3Dhttp%253A%252F%252Fisilinks.com%253A9000%252FLinks%252Fimages%252FAIP_Ret.gif)
![[ISI]](http://link.aip.org/link/?&l_creator=fthtml&l_dir=FWD&l_rel=CITES&from_key=JCPSA6000122000002024901000001&from_keyType=CVIPS&from_loc=AIP&to_j=JCPSA6&to_v=98&to_p=7420&to_loc=ISI&to_url=http%3A%2F%2Flinks.isiglobalnet2.com%2Fgateway%2FGateway.cgi%3FGWVersion%3D2%26SrcAuth%3DAIP%26SrcApp%3DAIP%26DestLinkType%3DFullRecord%26KeyUT%3DA1993LA76300088%26DestApp%3DWOS_CPL%26SrcURL%3Dhttp%253A%252F%252Flink.aip.org%252Flink%252F%253FJCP%252F122%252F024901%252F1%26SrcImageURL%3Dhttp%253A%252F%252Fisilinks.com%253A9000%252FLinks%252Fimages%252FAIP_Ret.gif)
![[ISI]](http://link.aip.org/link/?&l_creator=fthtml&l_dir=FWD&l_rel=CITES&from_key=JCPSA6000122000002024901000001&from_keyType=CVIPS&from_loc=AIP&to_j=18PLAF&to_v=26&to_p=271&to_loc=ISI&to_url=http%3A%2F%2Flinks.isiglobalnet2.com%2Fgateway%2FGateway.cgi%3FGWVersion%3D2%26SrcAuth%3DAIP%26SrcApp%3DAIP%26DestLinkType%3DFullRecord%26KeyUT%3DA1996VV76000005%26DestApp%3DWOS_CPL%26SrcURL%3Dhttp%253A%252F%252Flink.aip.org%252Flink%252F%253FJCP%252F122%252F024901%252F1%26SrcImageURL%3Dhttp%253A%252F%252Fisilinks.com%253A9000%252FLinks%252Fimages%252FAIP_Ret.gif)
![[ISI]](http://link.aip.org/link/?&l_creator=fthtml&l_dir=FWD&l_rel=CITES&from_key=JCPSA6000122000002024901000001&from_keyType=CVIPS&from_loc=AIP&to_j=PRCIEI&to_v=6&to_p=1467&to_loc=ISI&to_url=http%3A%2F%2Flinks.isiglobalnet2.com%2Fgateway%2FGateway.cgi%3FGWVersion%3D2%26SrcAuth%3DAIP%26SrcApp%3DAIP%26DestLinkType%3DFullRecord%26KeyUT%3DA1997XK77600011%26DestApp%3DWOS_CPL%26SrcURL%3Dhttp%253A%252F%252Flink.aip.org%252Flink%252F%253FJCP%252F122%252F024901%252F1%26SrcImageURL%3Dhttp%253A%252F%252Fisilinks.com%253A9000%252FLinks%252Fimages%252FAIP_Ret.gif)
![[ISI]](http://link.aip.org/link/?&l_creator=fthtml&l_dir=FWD&l_rel=CITES&from_key=JCPSA6000122000002024901000001&from_keyType=CVIPS&from_loc=AIP&to_j=JCPSA6&to_v=115&to_p=2323&to_loc=ISI&to_url=http%3A%2F%2Flinks.isiglobalnet2.com%2Fgateway%2FGateway.cgi%3FGWVersion%3D2%26SrcAuth%3DAIP%26SrcApp%3DAIP%26DestLinkType%3DFullRecord%26KeyUT%3D000169927700040%26DestApp%3DWOS_CPL%26SrcURL%3Dhttp%253A%252F%252Flink.aip.org%252Flink%252F%253FJCP%252F122%252F024901%252F1%26SrcImageURL%3Dhttp%253A%252F%252Fisilinks.com%253A9000%252FLinks%252Fimages%252FAIP_Ret.gif)
![[ISI]](http://link.aip.org/link/?&l_creator=fthtml&l_dir=FWD&l_rel=CITES&from_key=JCPSA6000122000002024901000001&from_keyType=CVIPS&from_loc=AIP&to_j=JCPSA6&to_v=118&to_p=7658&to_loc=ISI&to_url=http%3A%2F%2Flinks.isiglobalnet2.com%2Fgateway%2FGateway.cgi%3FGWVersion%3D2%26SrcAuth%3DAIP%26SrcApp%3DAIP%26DestLinkType%3DFullRecord%26KeyUT%3D000182157700055%26DestApp%3DWOS_CPL%26SrcURL%3Dhttp%253A%252F%252Flink.aip.org%252Flink%252F%253FJCP%252F122%252F024901%252F1%26SrcImageURL%3Dhttp%253A%252F%252Fisilinks.com%253A9000%252FLinks%252Fimages%252FAIP_Ret.gif)
![[ISI]](http://link.aip.org/link/?&l_creator=fthtml&l_dir=FWD&l_rel=CITES&from_key=JCPSA6000122000002024901000001&from_keyType=CVIPS&from_loc=AIP&to_j=JMOBAK&to_v=258&to_p=367&to_loc=ISI&to_url=http%3A%2F%2Flinks.isiglobalnet2.com%2Fgateway%2FGateway.cgi%3FGWVersion%3D2%26SrcAuth%3DAIP%26SrcApp%3DAIP%26DestLinkType%3DFullRecord%26KeyUT%3DA1996UH33000013%26DestApp%3DWOS_CPL%26SrcURL%3Dhttp%253A%252F%252Flink.aip.org%252Flink%252F%253FJCP%252F122%252F024901%252F1%26SrcImageURL%3Dhttp%253A%252F%252Fisilinks.com%253A9000%252FLinks%252Fimages%252FAIP_Ret.gif)
![[ISI]](http://link.aip.org/link/?&l_creator=fthtml&l_dir=FWD&l_rel=CITES&from_key=JCPSA6000122000002024901000001&from_keyType=CVIPS&from_loc=AIP&to_j=JMOBAK&to_v=268&to_p=209&to_loc=ISI&to_url=http%3A%2F%2Flinks.isiglobalnet2.com%2Fgateway%2FGateway.cgi%3FGWVersion%3D2%26SrcAuth%3DAIP%26SrcApp%3DAIP%26DestLinkType%3DFullRecord%26KeyUT%3DA1997WV87100019%26DestApp%3DWOS_CPL%26SrcURL%3Dhttp%253A%252F%252Flink.aip.org%252Flink%252F%253FJCP%252F122%252F024901%252F1%26SrcImageURL%3Dhttp%253A%252F%252Fisilinks.com%253A9000%252FLinks%252Fimages%252FAIP_Ret.gif)
![[ISI]](http://link.aip.org/link/?&l_creator=fthtml&l_dir=FWD&l_rel=CITES&from_key=JCPSA6000122000002024901000001&from_keyType=CVIPS&from_loc=AIP&to_j=BICHAW&to_v=29&to_p=3287&to_loc=ISI&to_url=http%3A%2F%2Flinks.isiglobalnet2.com%2Fgateway%2FGateway.cgi%3FGWVersion%3D2%26SrcAuth%3DAIP%26SrcApp%3DAIP%26DestLinkType%3DFullRecord%26KeyUT%3DA1990CX49200020%26DestApp%3DWOS_CPL%26SrcURL%3Dhttp%253A%252F%252Flink.aip.org%252Flink%252F%253FJCP%252F122%252F024901%252F1%26SrcImageURL%3Dhttp%253A%252F%252Fisilinks.com%253A9000%252FLinks%252Fimages%252FAIP_Ret.gif)
![[ISI]](http://link.aip.org/link/?&l_creator=fthtml&l_dir=FWD&l_rel=CITES&from_key=JCPSA6000122000002024901000001&from_keyType=CVIPS&from_loc=AIP&to_j=IJQCB2&to_v=77&to_p=90&to_loc=ISI&to_url=http%3A%2F%2Flinks.isiglobalnet2.com%2Fgateway%2FGateway.cgi%3FGWVersion%3D2%26SrcAuth%3DAIP%26SrcApp%3DAIP%26DestLinkType%3DFullRecord%26KeyUT%3D000085144900008%26DestApp%3DWOS_CPL%26SrcURL%3Dhttp%253A%252F%252Flink.aip.org%252Flink%252F%253FJCP%252F122%252F024901%252F1%26SrcImageURL%3Dhttp%253A%252F%252Fisilinks.com%253A9000%252FLinks%252Fimages%252FAIP_Ret.gif)
![[ISI]](http://link.aip.org/link/?&l_creator=fthtml&l_dir=FWD&l_rel=CITES&from_key=JCPSA6000122000002024901000001&from_keyType=CVIPS&from_loc=AIP&to_j=PNASA6&to_v=96&to_p=2025&to_loc=ISI&to_url=http%3A%2F%2Flinks.isiglobalnet2.com%2Fgateway%2FGateway.cgi%3FGWVersion%3D2%26SrcAuth%3DAIP%26SrcApp%3DAIP%26DestLinkType%3DFullRecord%26KeyUT%3D000078956600041%26DestApp%3DWOS_CPL%26SrcURL%3Dhttp%253A%252F%252Flink.aip.org%252Flink%252F%253FJCP%252F122%252F024901%252F1%26SrcImageURL%3Dhttp%253A%252F%252Fisilinks.com%253A9000%252FLinks%252Fimages%252FAIP_Ret.gif)
![[ISI]](http://link.aip.org/link/?&l_creator=fthtml&l_dir=FWD&l_rel=CITES&from_key=JCPSA6000122000002024901000001&from_keyType=CVIPS&from_loc=AIP&to_j=NATUAS&to_v=256&to_p=705&to_loc=ISI&to_url=http%3A%2F%2Flinks.isiglobalnet2.com%2Fgateway%2FGateway.cgi%3FGWVersion%3D2%26SrcAuth%3DAIP%26SrcApp%3DAIP%26DestLinkType%3DFullRecord%26KeyUT%3DA1975AN21600015%26DestApp%3DWOS_CPL%26SrcURL%3Dhttp%253A%252F%252Flink.aip.org%252Flink%252F%253FJCP%252F122%252F024901%252F1%26SrcImageURL%3Dhttp%253A%252F%252Fisilinks.com%253A9000%252FLinks%252Fimages%252FAIP_Ret.gif)
![[ISI]](http://link.aip.org/link/?&l_creator=fthtml&l_dir=FWD&l_rel=CITES&from_key=JCPSA6000122000002024901000001&from_keyType=CVIPS&from_loc=AIP&to_j=JMOBAK&to_v=247&to_p=536&to_loc=ISI&to_url=http%3A%2F%2Flinks.isiglobalnet2.com%2Fgateway%2FGateway.cgi%3FGWVersion%3D2%26SrcAuth%3DAIP%26SrcApp%3DAIP%26DestLinkType%3DFullRecord%26KeyUT%3DA1995QQ85600003%26DestApp%3DWOS_CPL%26SrcURL%3Dhttp%253A%252F%252Flink.aip.org%252Flink%252F%253FJCP%252F122%252F024901%252F1%26SrcImageURL%3Dhttp%253A%252F%252Fisilinks.com%253A9000%252FLinks%252Fimages%252FAIP_Ret.gif)
![[ISI]](http://link.aip.org/link/?&l_creator=fthtml&l_dir=FWD&l_rel=CITES&from_key=JCPSA6000122000002024901000001&from_keyType=CVIPS&from_loc=AIP&to_j=SCIEAS&to_v=262&to_p=208&to_loc=ISI&to_url=http%3A%2F%2Flinks.isiglobalnet2.com%2Fgateway%2FGateway.cgi%3FGWVersion%3D2%26SrcAuth%3DAIP%26SrcApp%3DAIP%26DestLinkType%3DFullRecord%26KeyUT%3DA1993MA66500025%26DestApp%3DWOS_CPL%26SrcURL%3Dhttp%253A%252F%252Flink.aip.org%252Flink%252F%253FJCP%252F122%252F024901%252F1%26SrcImageURL%3Dhttp%253A%252F%252Fisilinks.com%253A9000%252FLinks%252Fimages%252FAIP_Ret.gif)
![[ISI]](http://link.aip.org/link/?&l_creator=fthtml&l_dir=FWD&l_rel=CITES&from_key=JCPSA6000122000002024901000001&from_keyType=CVIPS&from_loc=AIP&to_j=NARHAD&to_v=28&to_p=235&to_loc=ISI&to_url=http%3A%2F%2Flinks.isiglobalnet2.com%2Fgateway%2FGateway.cgi%3FGWVersion%3D2%26SrcAuth%3DAIP%26SrcApp%3DAIP%26DestLinkType%3DFullRecord%26KeyUT%3D000084896300069%26DestApp%3DWOS_CPL%26SrcURL%3Dhttp%253A%252F%252Flink.aip.org%252Flink%252F%253FJCP%252F122%252F024901%252F1%26SrcImageURL%3Dhttp%253A%252F%252Fisilinks.com%253A9000%252FLinks%252Fimages%252FAIP_Ret.gif)
![[ISI]](http://link.aip.org/link/?&l_creator=fthtml&l_dir=FWD&l_rel=CITES&from_key=JCPSA6000122000002024901000001&from_keyType=CVIPS&from_loc=AIP&to_j=JMOBAK&to_v=226&to_p=507&to_loc=ISI&to_url=http%3A%2F%2Flinks.isiglobalnet2.com%2Fgateway%2FGateway.cgi%3FGWVersion%3D2%26SrcAuth%3DAIP%26SrcApp%3DAIP%26DestLinkType%3DFullRecord%26KeyUT%3DA1992JF96600020%26DestApp%3DWOS_CPL%26SrcURL%3Dhttp%253A%252F%252Flink.aip.org%252Flink%252F%253FJCP%252F122%252F024901%252F1%26SrcImageURL%3Dhttp%253A%252F%252Fisilinks.com%253A9000%252FLinks%252Fimages%252FAIP_Ret.gif)